

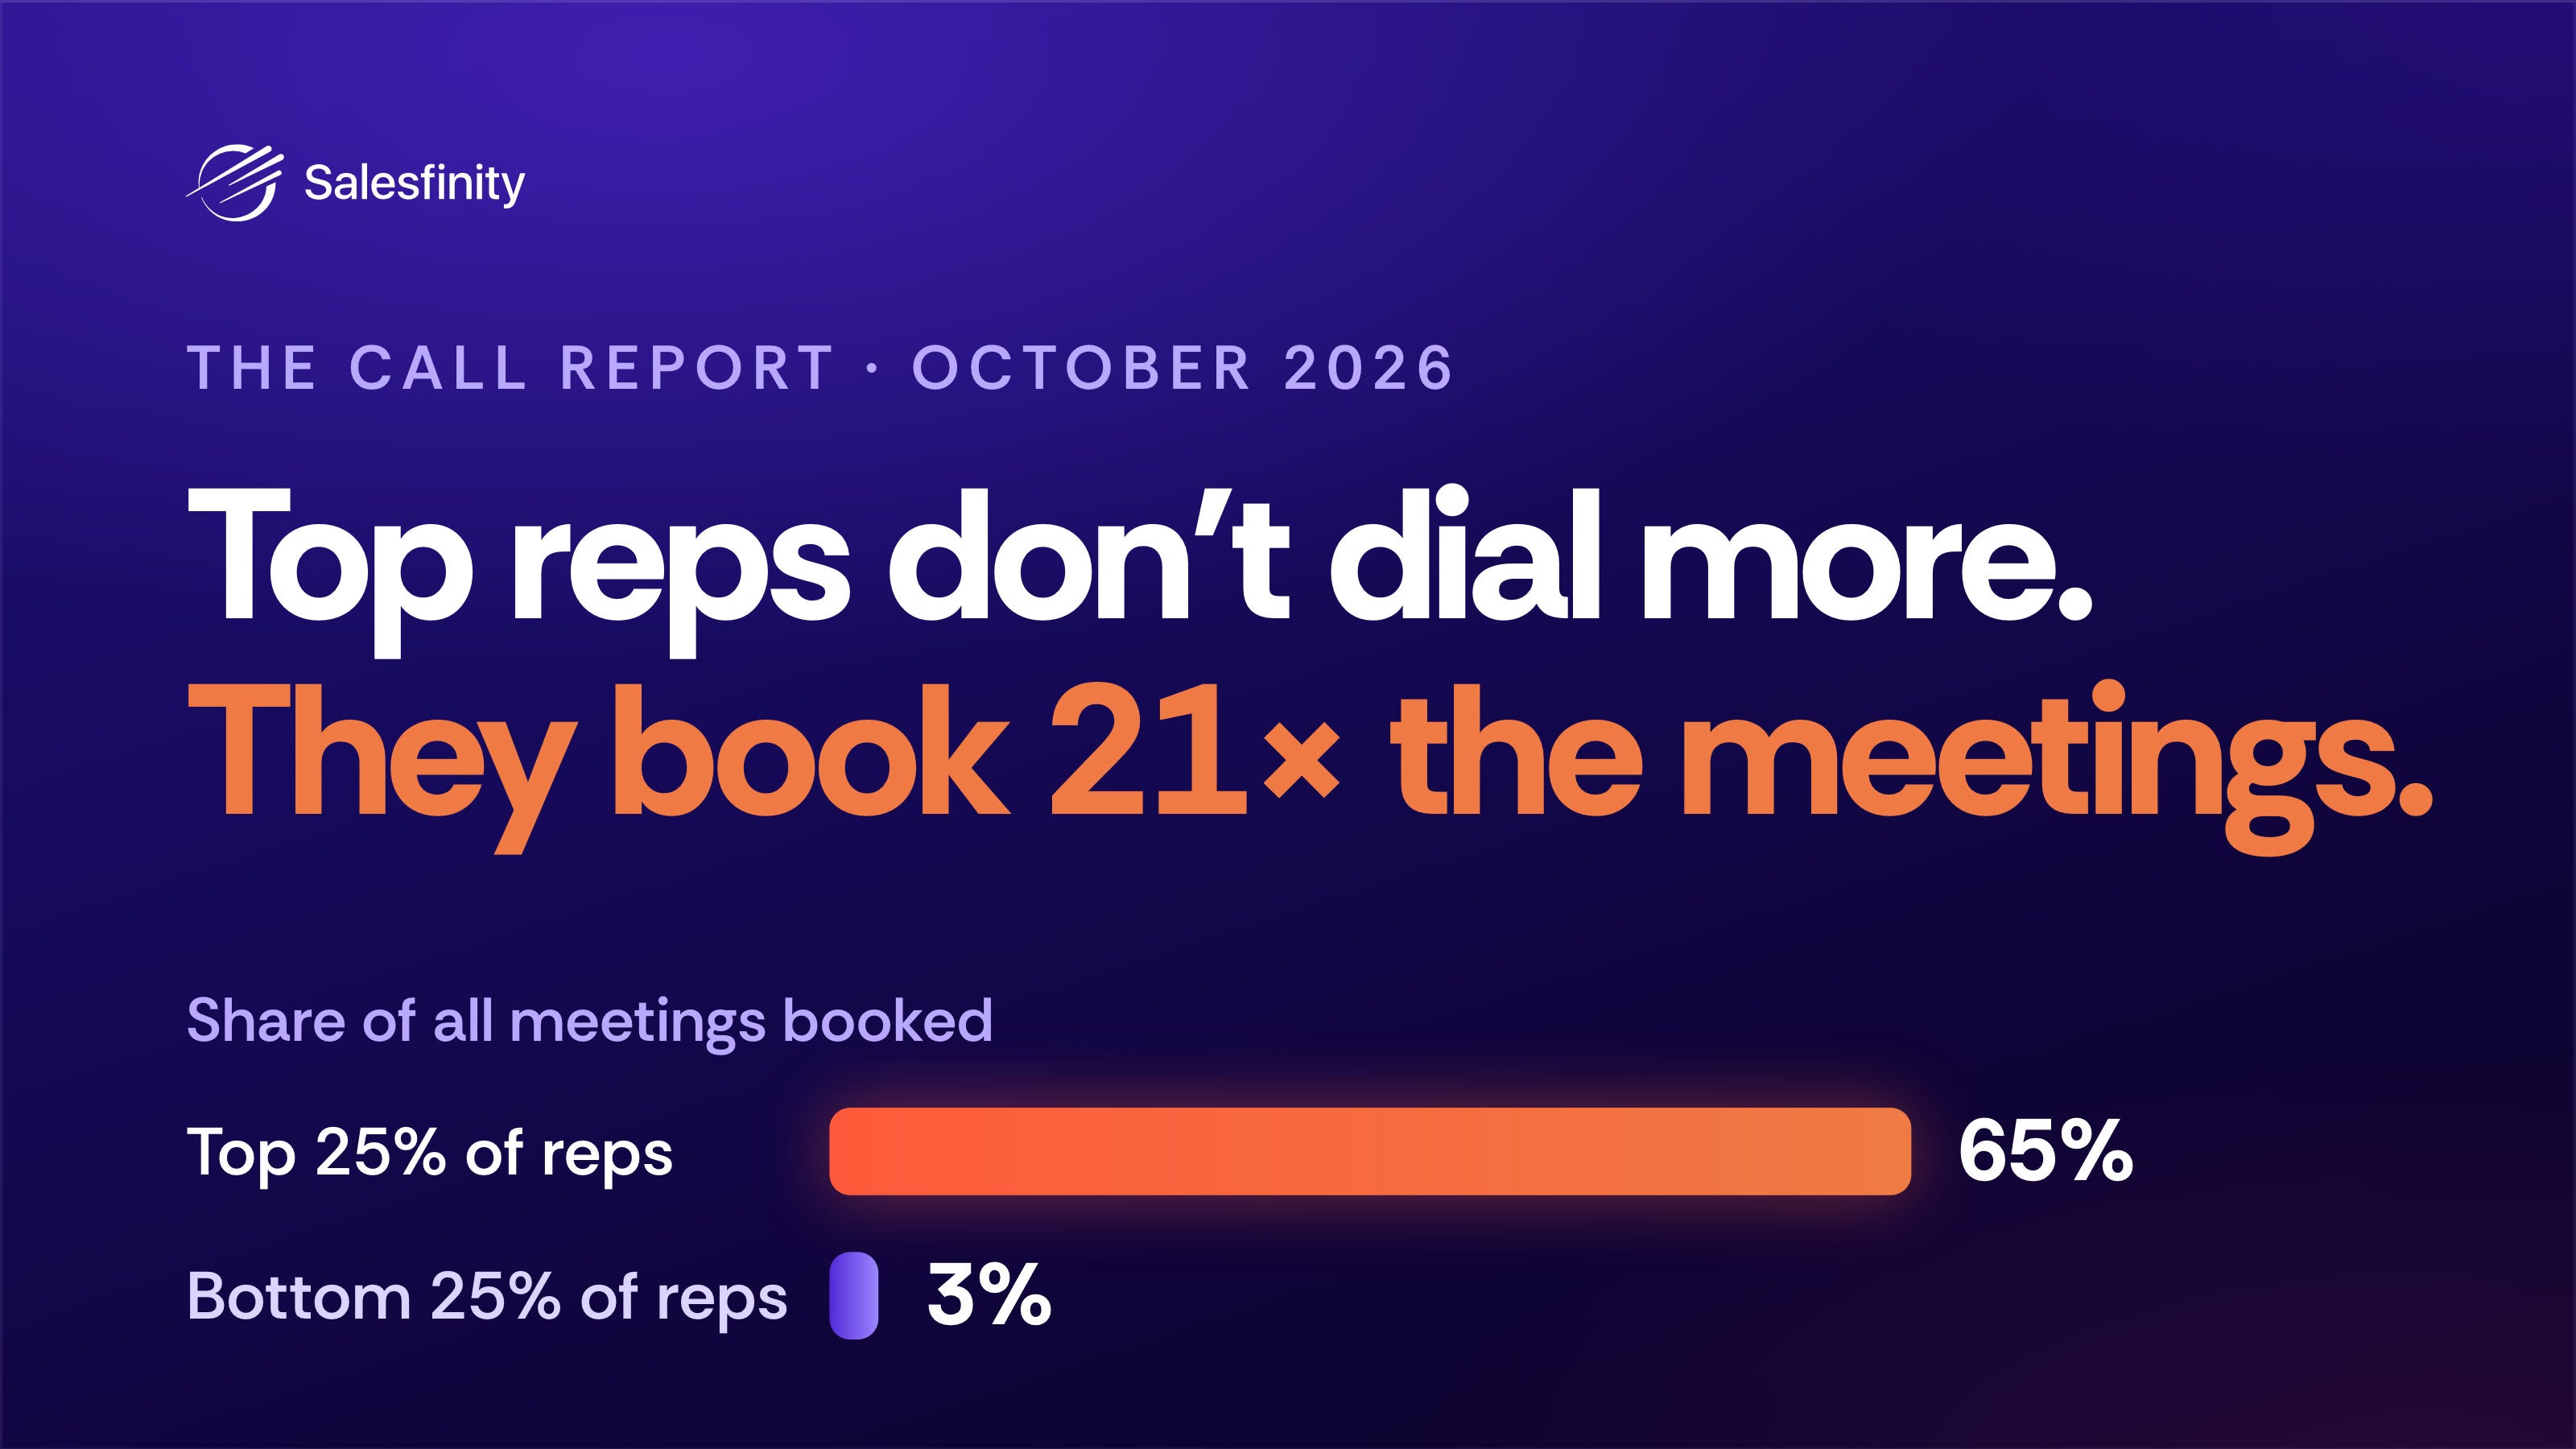
We went quiet for three months. The phones didn't. For this issue we analyzed a sample of 1.8 million cold calls from the last 30 days on Salesfinity, and turned them into benchmarks you can grade your team against. It's the biggest Call Report we've run.
Here's the number that should change how you run your floor. Among the reps we graded, the top quarter made 23% of the dials and booked 65% of the meetings. The bottom quarter made 28% of the dials and booked 3%. That's 21x the meetings, on fewer dials.
And no, the top reps aren't outworking anyone. The typical top-quarter rep made 184 dials a day to the bottom quarter's 221, over the same 4 to 5 hours, on the same 16 days. Whatever they're doing, it isn't volume.
Two caveats up front, because you'll think of them anyway. Some of that gap is a lucky month: rank reps on their first two weeks and measure the next two, and the top quarter still books 9x the bottom quarter's rate. And much of it is between companies: inside the same team, the top half books 2.2x the bottom half. That smaller gap is the one you can close, and closing it is worth about 15% more meetings.
How to use this report:
Compute three numbers for your team: connect rate (of dials), conversation rate (of connects), meeting rate (of conversations).
Find your row on the Benchmark Card.
Find your leak, then run the 30-day plan at the bottom.
Along the way, we correct two things we told you in July.
This Month's Snapshot
Out of every 1,000 dials: about 100 humans, 39 conversations and 3.3 meetings.
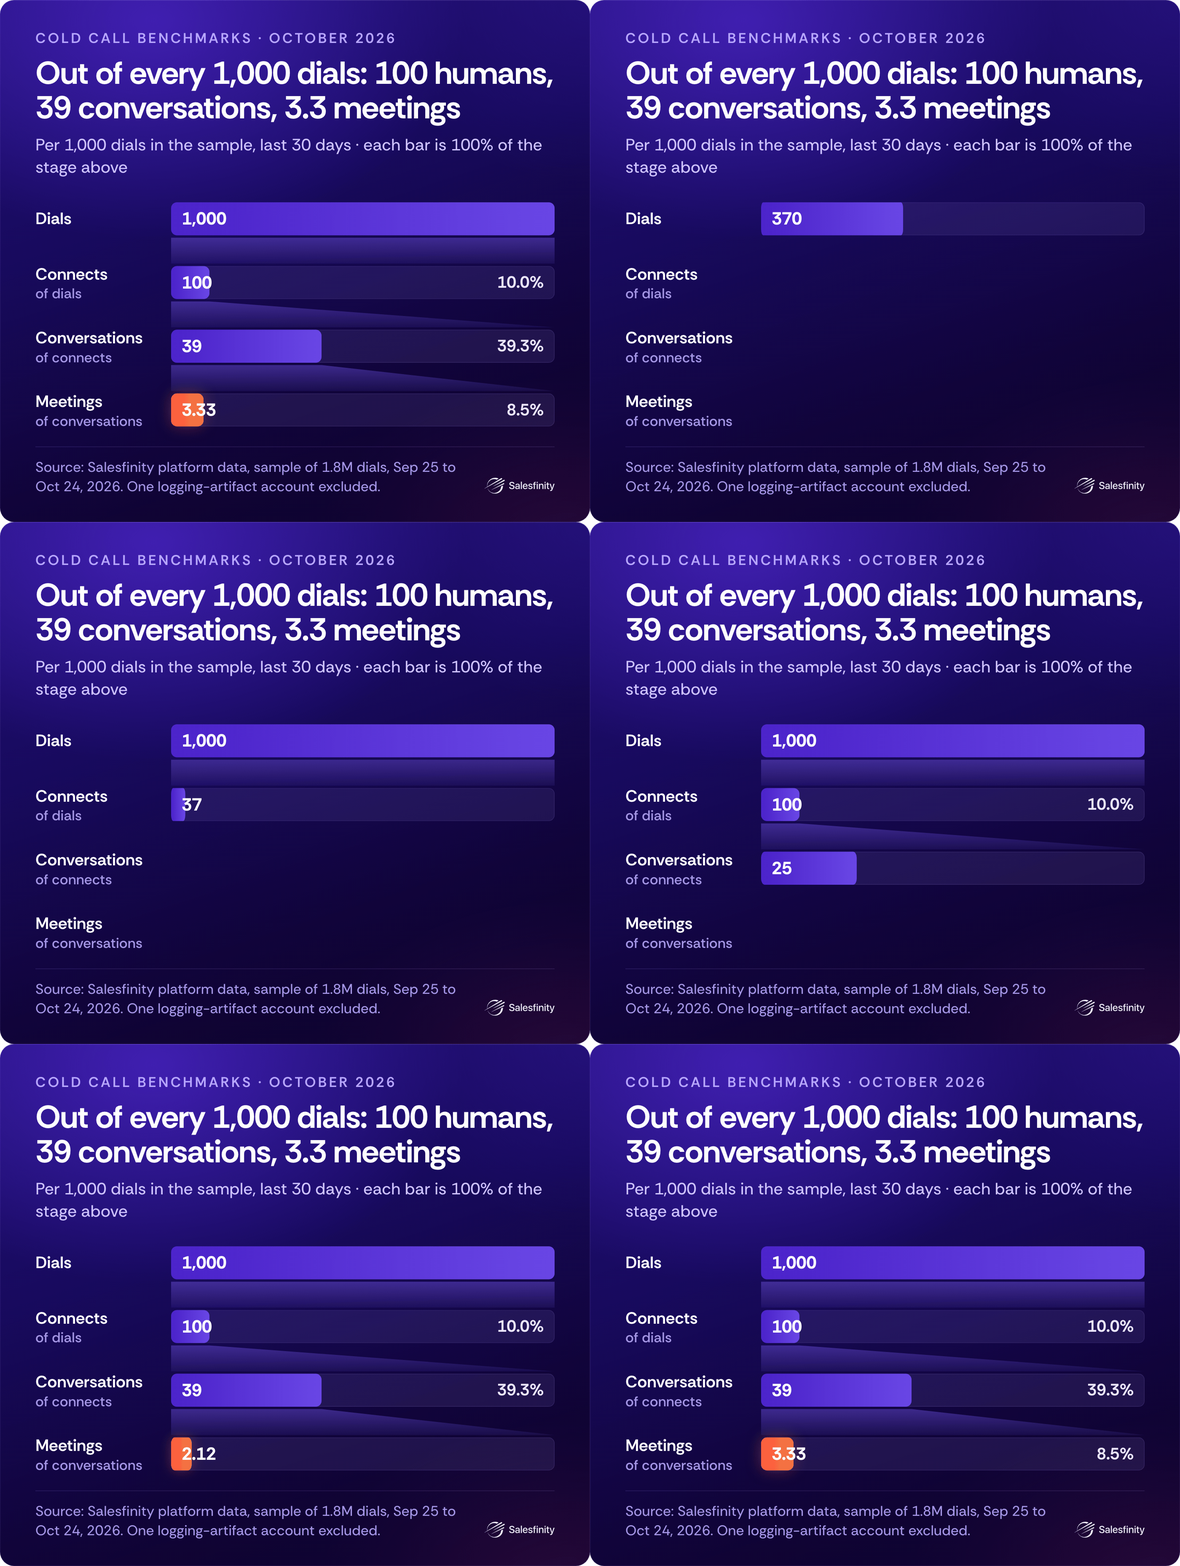
Connect rate (a human answered): 10.0% of dials (10.7% last month)
Conversation rate (a connect that lasts more than 30 seconds): 39.3% of connects (36.1% last month)
Meeting rate: 8.5% of conversations (8.6% last month)
Meetings per 1,000 dials: 3.33, the same as last month. One meeting every 300 dials.
What changed since July
1. The average got better.
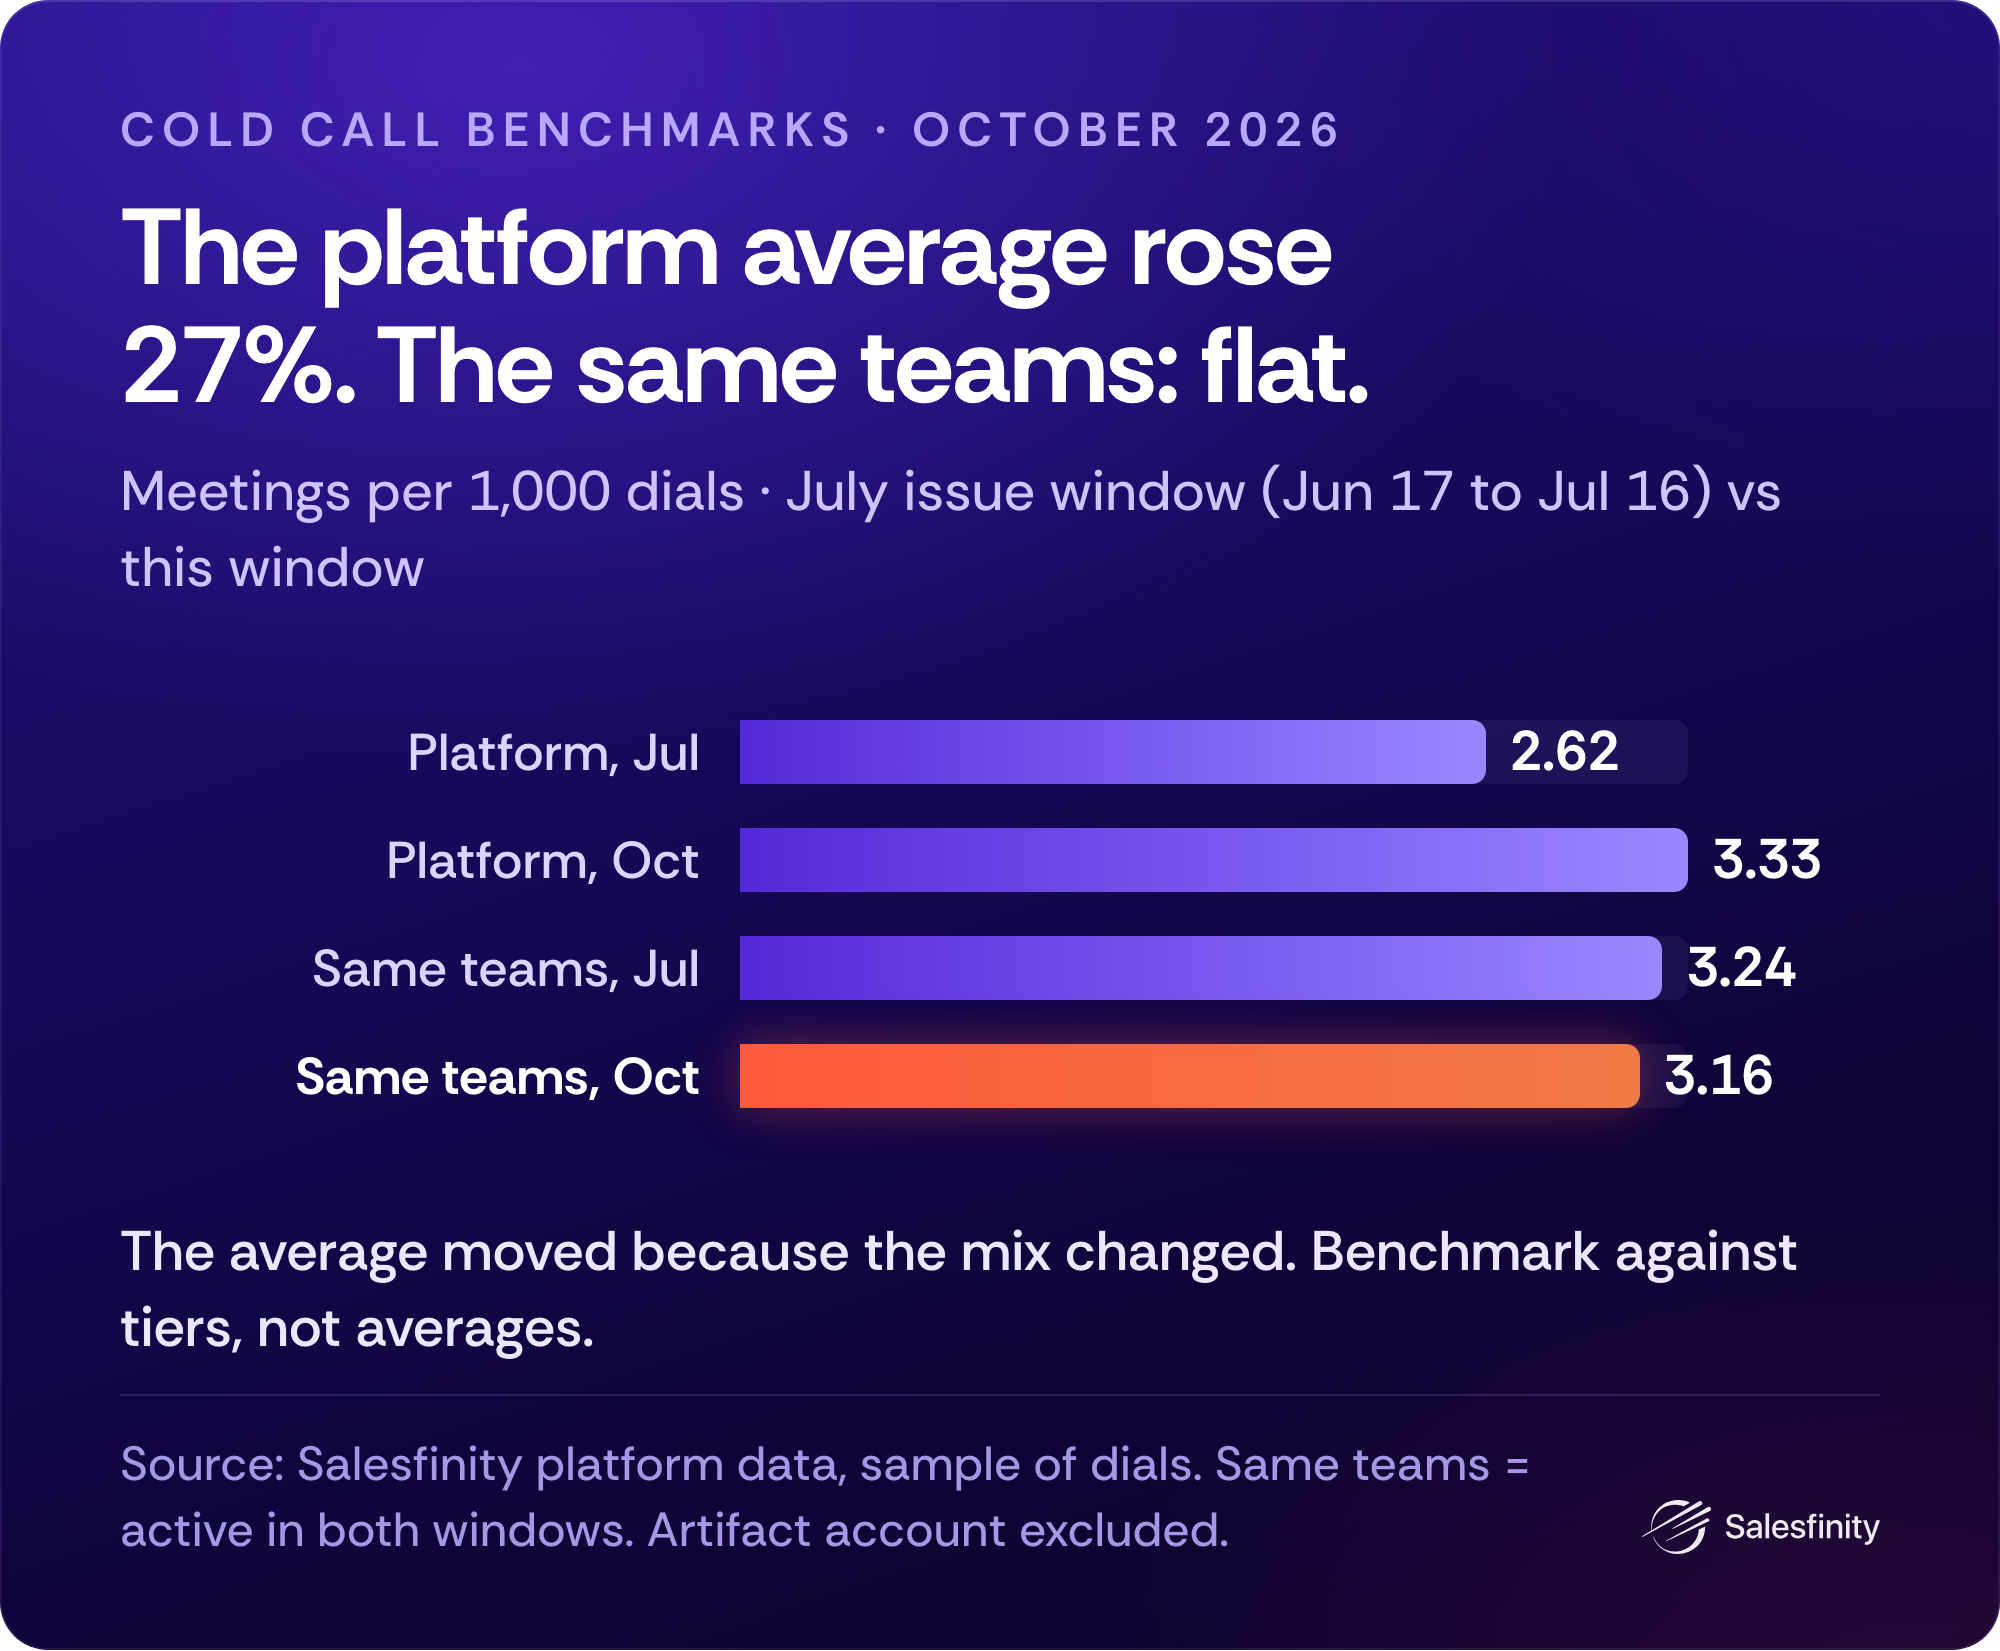
In July it took 382 dials to book a meeting on the platform. This month it took 300: 27% more meetings per dial.
If your number hasn't moved since summer, you're not behind. You're normal. And 2 in 3 graded reps sit below the platform average anyway. That's why everything below grades you against tiers, not the average.
2. Monday isn't the best day anymore. Unless you call North America. Platform-wide, day of week is now flat (3.18 to 3.39 meetings per 1,000 dials).
The Benchmark Card
Find your row. The top 10% of reps book a meeting every 110 dials. The median rep needs 542.
The formula: meetings divided by dials, times 1,000. Pull your last 4 weeks, per rep and for the team.
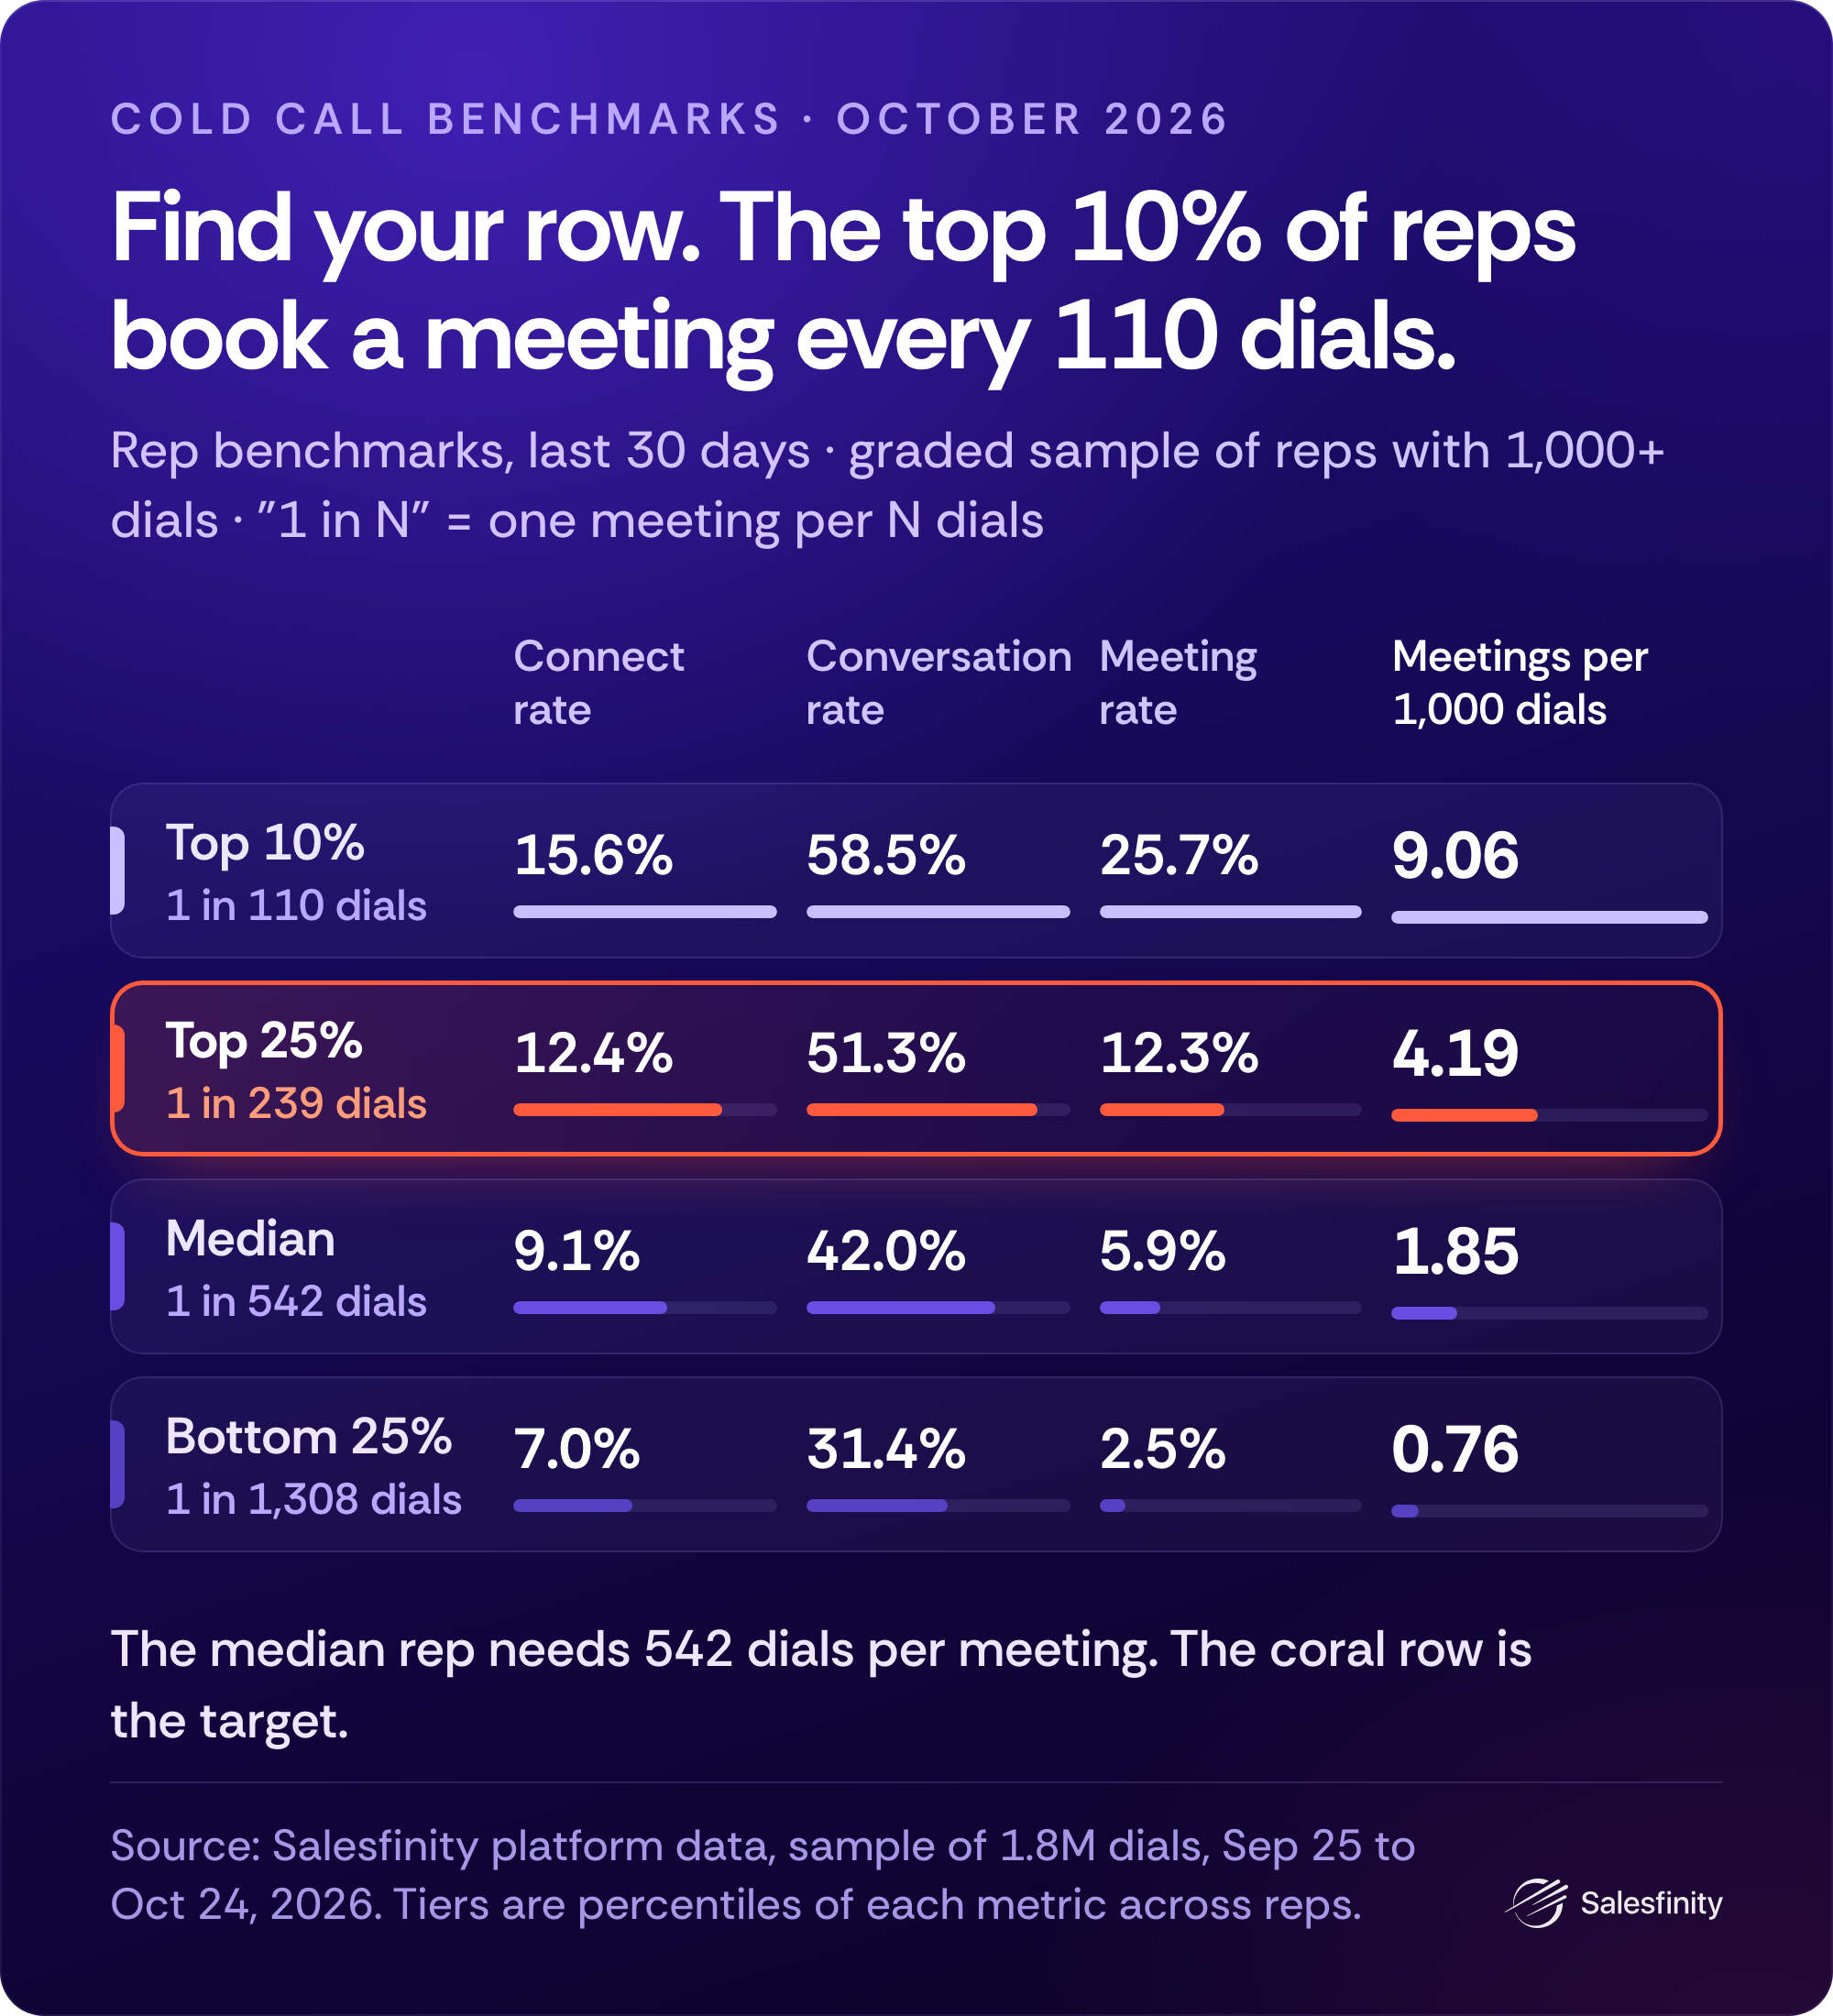
Reps (graded sample, 1,000+ dials each):
Top 10%: 15.6% connect rate · 58.5% conversation rate · 25.7% meeting rate · 9.06 meetings per 1,000 dials (1 in 110 dials)
Top 25%: 12.4% · 51.3% · 12.3% · 4.19 (1 in 239)
Median: 9.1% · 42.0% · 5.9% · 1.85 (1 in 542)
Bottom 25%: 7.0% · 31.4% · 2.5% · 0.76 (1 in 1,308)
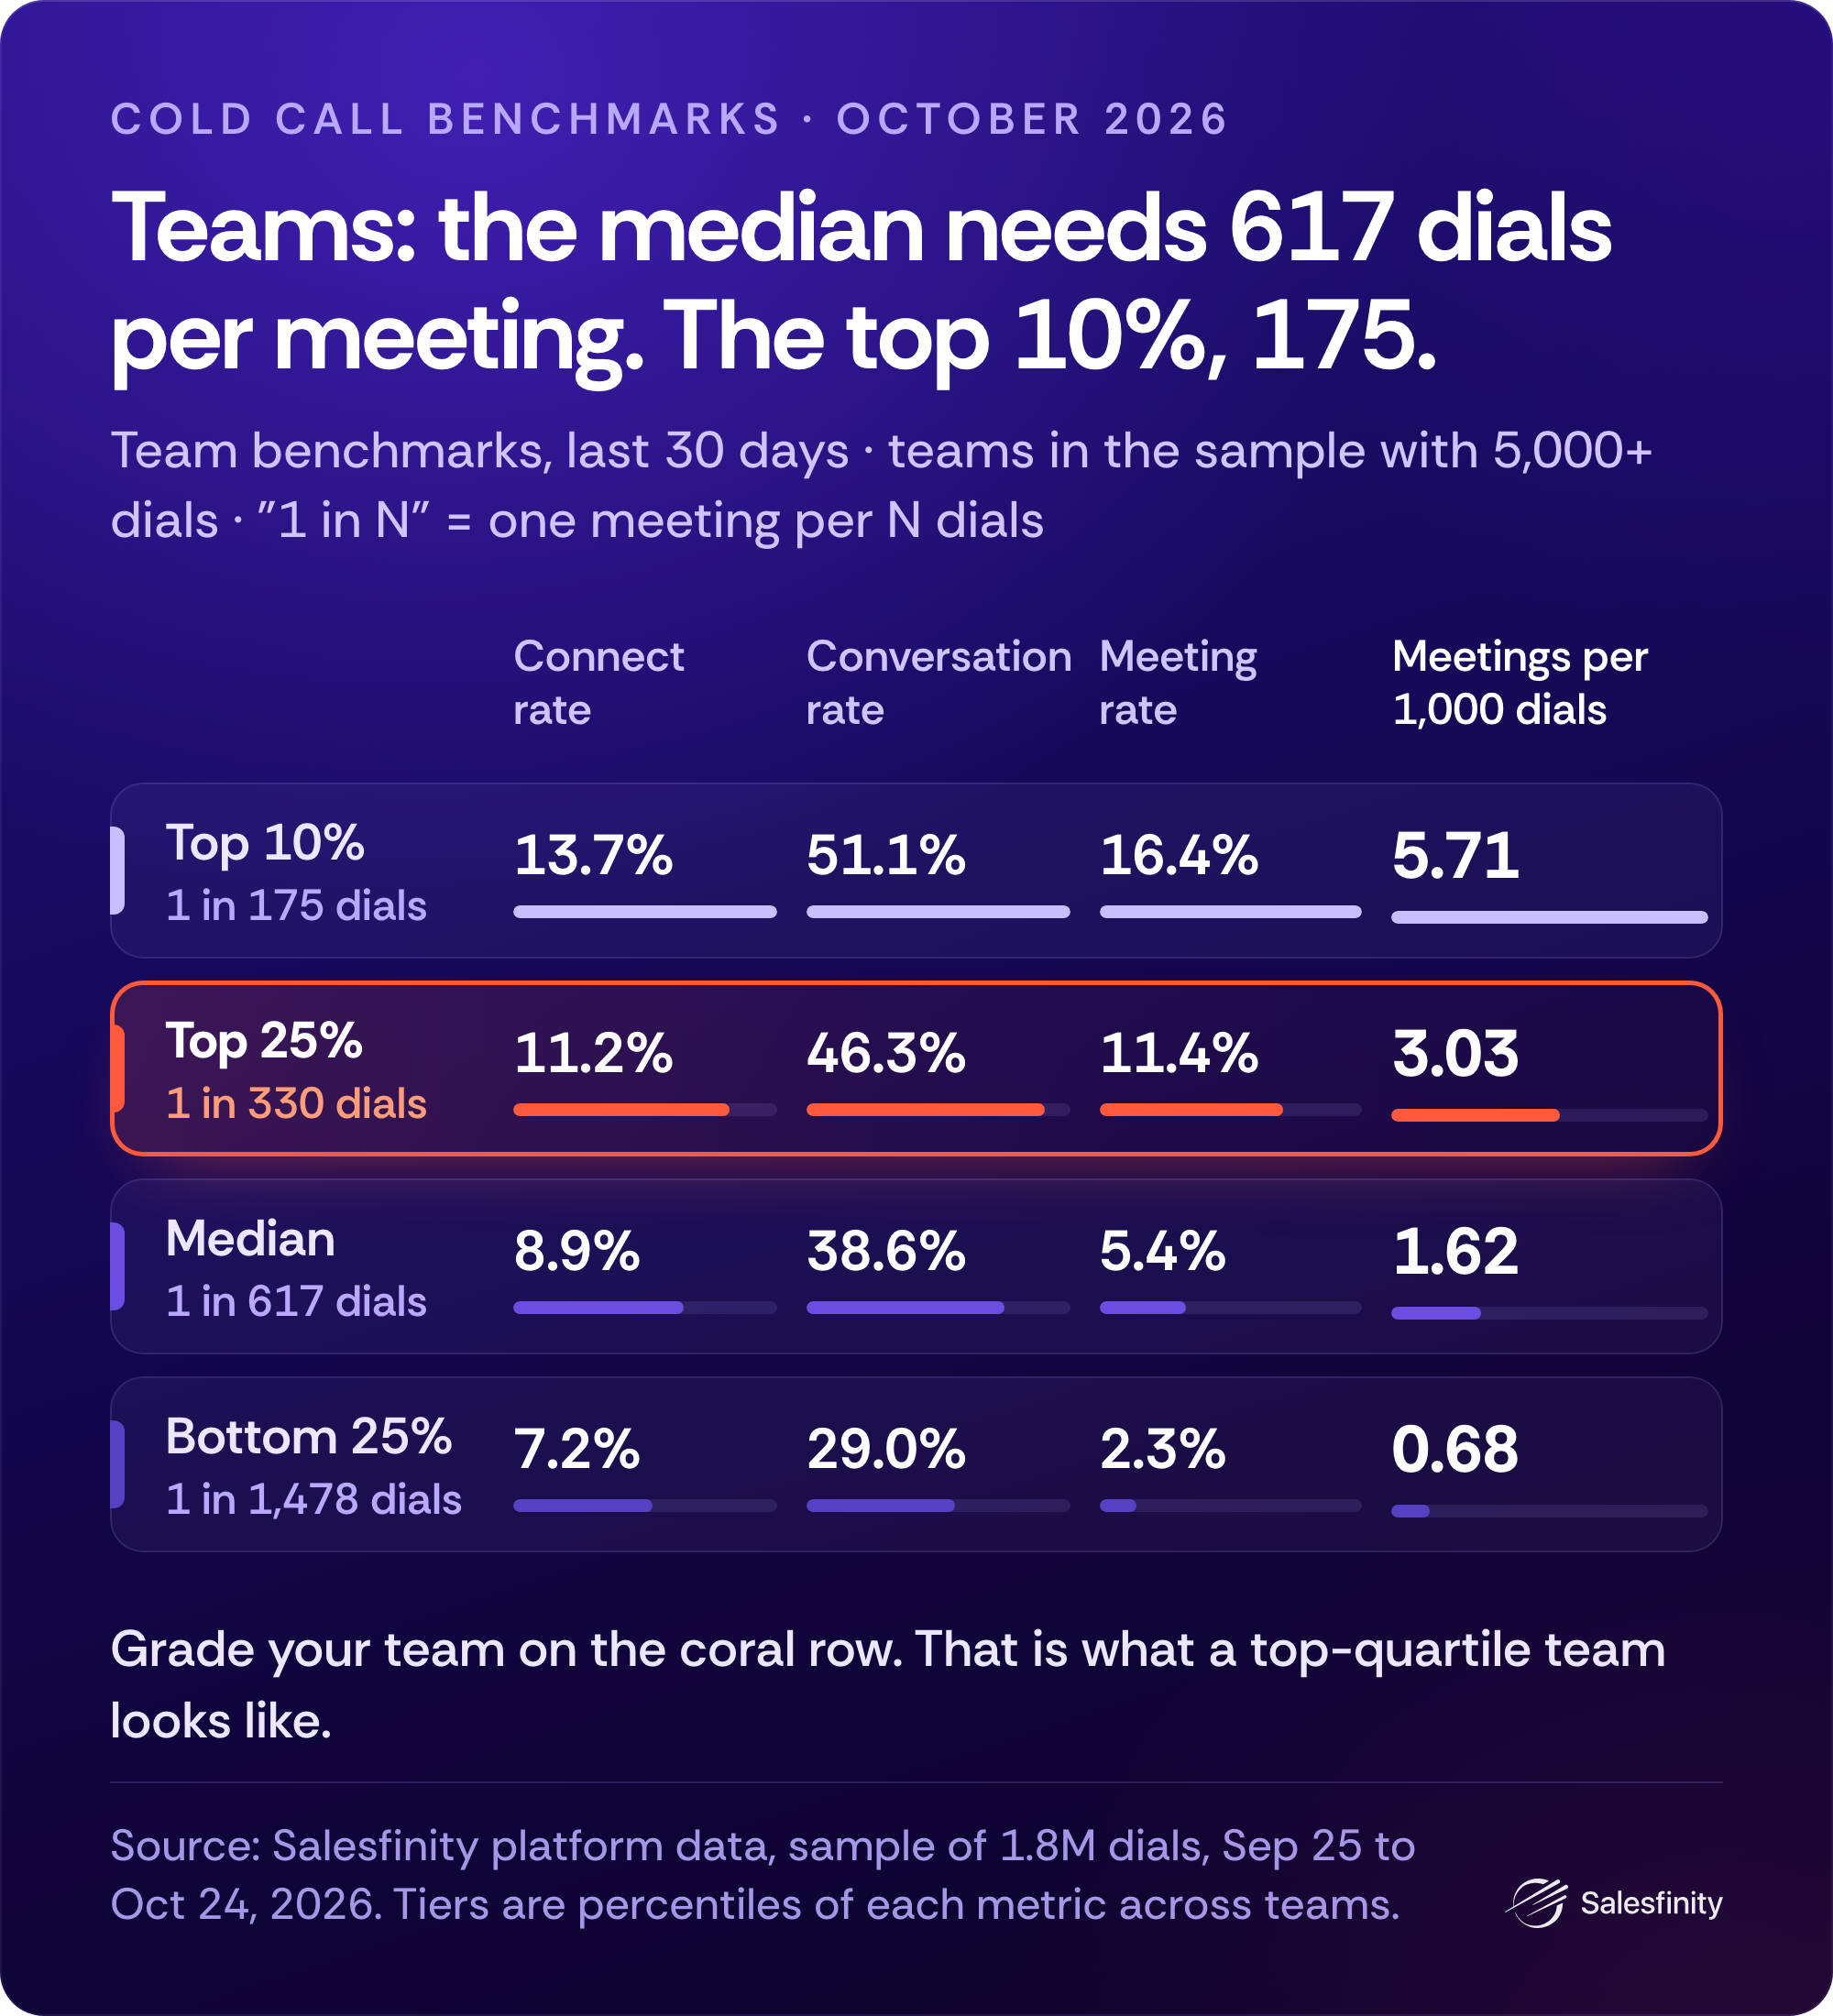
Teams (5,000+ dials each):
Top 10%: 13.7% · 51.1% · 16.4% · 5.71 (1 in 175)
Top 25%: 11.2% · 46.3% · 11.4% · 3.03 (1 in 330)
Median: 8.9% · 38.6% · 5.4% · 1.62 (1 in 617)
Bottom 25%: 7.2% · 29.0% · 2.3% · 0.68 (1 in 1,478)
Region matters for pickup. North American teams connect less: a team median connect rate of 7.5% of dials (bottom quarter below 6.4%), against 8.9% for UK & Ireland teams (bottom quarter below 7.7%). Grade pickup inside your region.
How to read it:
Each column is its own ranking, so the rows don't multiply. A rep can be top 10% on connects and bottom 25% on meetings.
The score itself: meetings per rep per week run 0.5 / 1.2 / 3.3 / 9.0 (bottom 25% / median / top 25% / top 10%).
Rank on meetings per week. Coach on meetings per 1,000 dials. A rep can raise their meetings per 1,000 dials by slowing down and booking less. Meetings are still the score.
Heavy parallel dialers rank a little lower per dial than per hour. If you run 4 or 5 lines, also check meetings per 10 dialing hours: 0.37 / 0.83 / 2.15 / 4.56 (bottom 25% / median / top 25% / top 10%).
Don't judge a rep on a week. At a few meetings a week, weekly numbers swing about as much as chance does. Judge meeting rate only after about 200 conversations, which is roughly two months for a median rep. Treat a single month's row as provisional.
Translate your dialer. A connect is a live human, not an answering machine. If your dialer counts differently, skip connect rate and grade yourself on conversations per 100 dials: 2.0 / 3.1 / 4.6 / 6.5 for team bottom 25% / median / top 25% / top 10%. And a "meeting" here is a meeting set on the call, not a meeting held.
The Gap
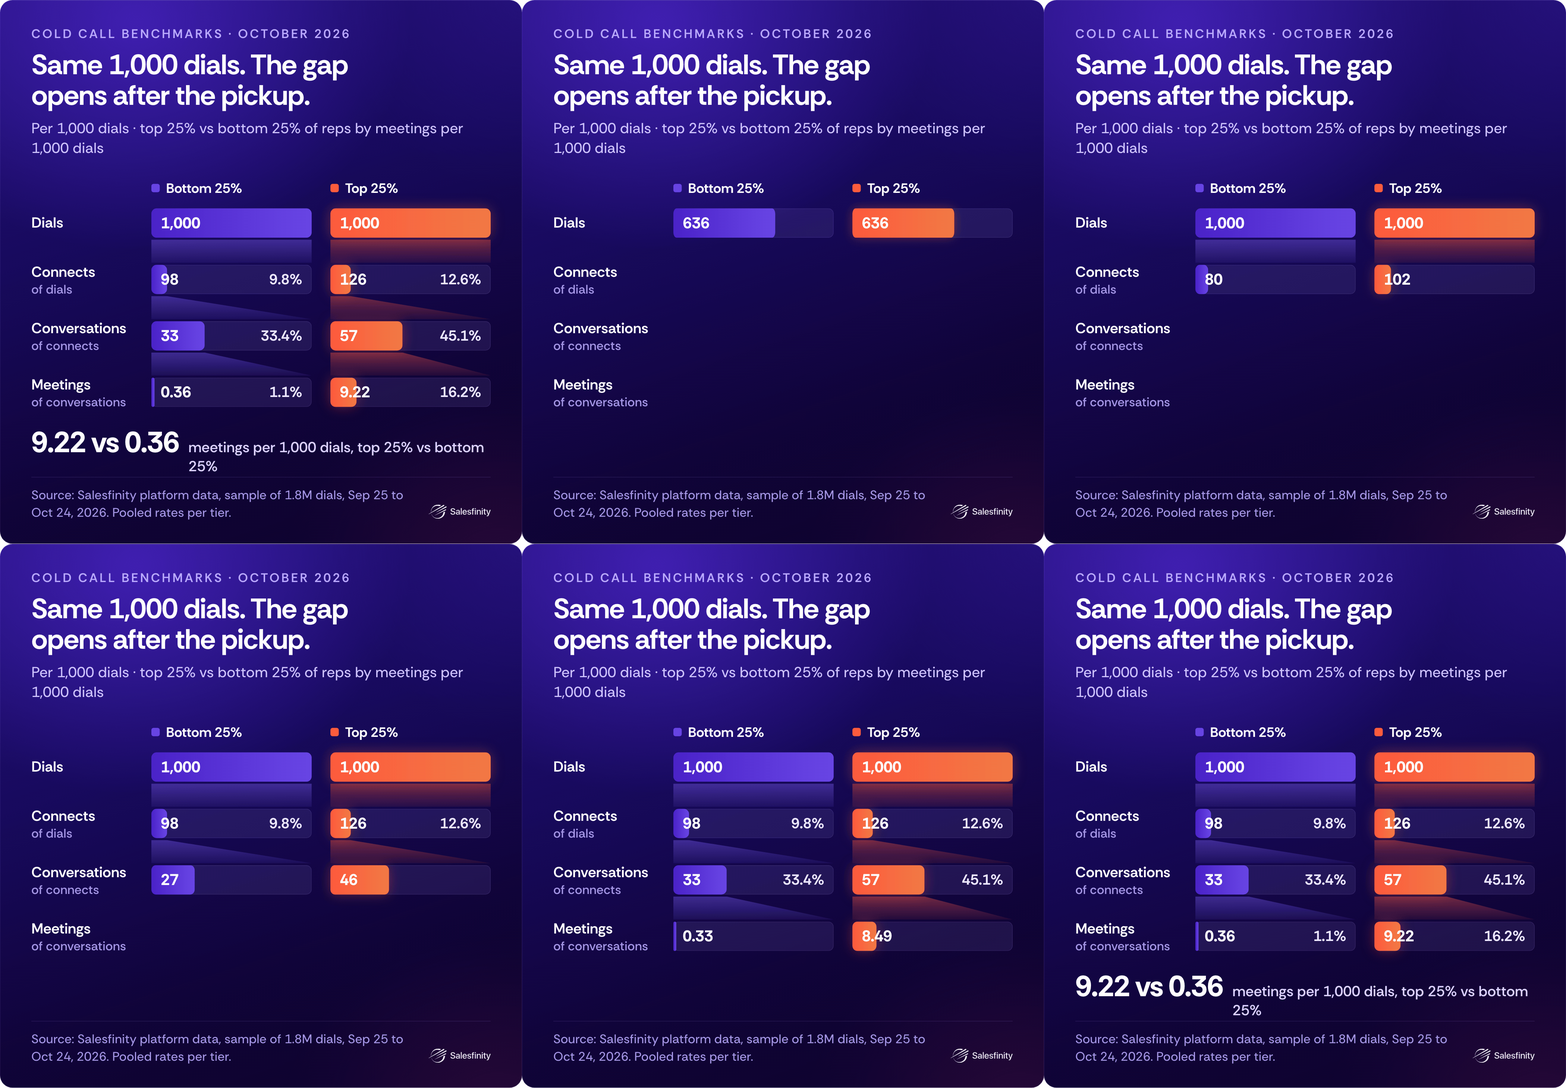
Top-quarter reps book 21x the meetings of bottom-quarter reps, on fewer dials.
The top quarter booked 21x the bottom quarter's meetings while making 17% fewer dials. Even the weakest top-quarter rep (4.19 per 1,000 dials) books 5.5x what the strongest bottom-quarter rep does (0.76).
Before you forward that: most of this gap is between companies, not between reps. Only about 1 in 8 of the teams that supply top- or bottom-quarter reps have reps in both, and the team a rep sits on explains 56% of the difference between reps. Most likely that's different products, markets and lists. So here's the number you can act on.
Inside the same team, same manager, the top half books 2.2x the bottom half. On teams with four or more reps, the best rep books a median 2.3x the team's median rep. Lift every below-median rep to their own team's median and the team books about 15% more meetings (15.5% on teams with four or more reps), from dials it's already making.
Is it skill or a lucky month? Mostly skill. Ranked on their first two weeks, the top quarter still booked 9x the bottom quarter's rate over the next two (7.7 vs 0.8 meetings per 1,000 dials), and 89% of them stayed above the median.
Split reps at the median on volume and on efficiency and you get four groups:
Machines (high volume, high yield): 36% of dials, 64% of meetings. 277 dials a day over 6.0 hours.
Snipers (low volume, high yield): 11% of dials, 23% of meetings. 129 dials a day over 3.7 hours.
Treadmills (high volume, low yield): 44% of dials, 11% of meetings. 297 dials a day over 5.3 hours, on more lines (3.7 vs 3.0 for Machines).
Low volume, low yield: 9% of dials, 2% of meetings.
Machines and Snipers book at almost the same rate per dial (4.6 vs 4.1 per 1,000). Machines just stay on the phone longer. Treadmills dial as much as Machines and book a sixth of the meetings, on more lines: a setting the manager controls. (A persona describes a month of numbers, not a person.)
For whoever sets headcount: the highest-volume teams are no more efficient per dial than the rest, and most teams that grew their dials 2.5x or more in a month got less efficient (a small sample).
Your math (Illustration). A team booking 74 meetings a month that lifts its below-median reps to the team's own median books about 85. Same dials, same hours. Multiply the difference by your show rate and your meeting-to-opportunity rate.
Where the Gap Lives
Reach explains 8% of the gap. The first 30 seconds, 9%. Conversion, 83%.
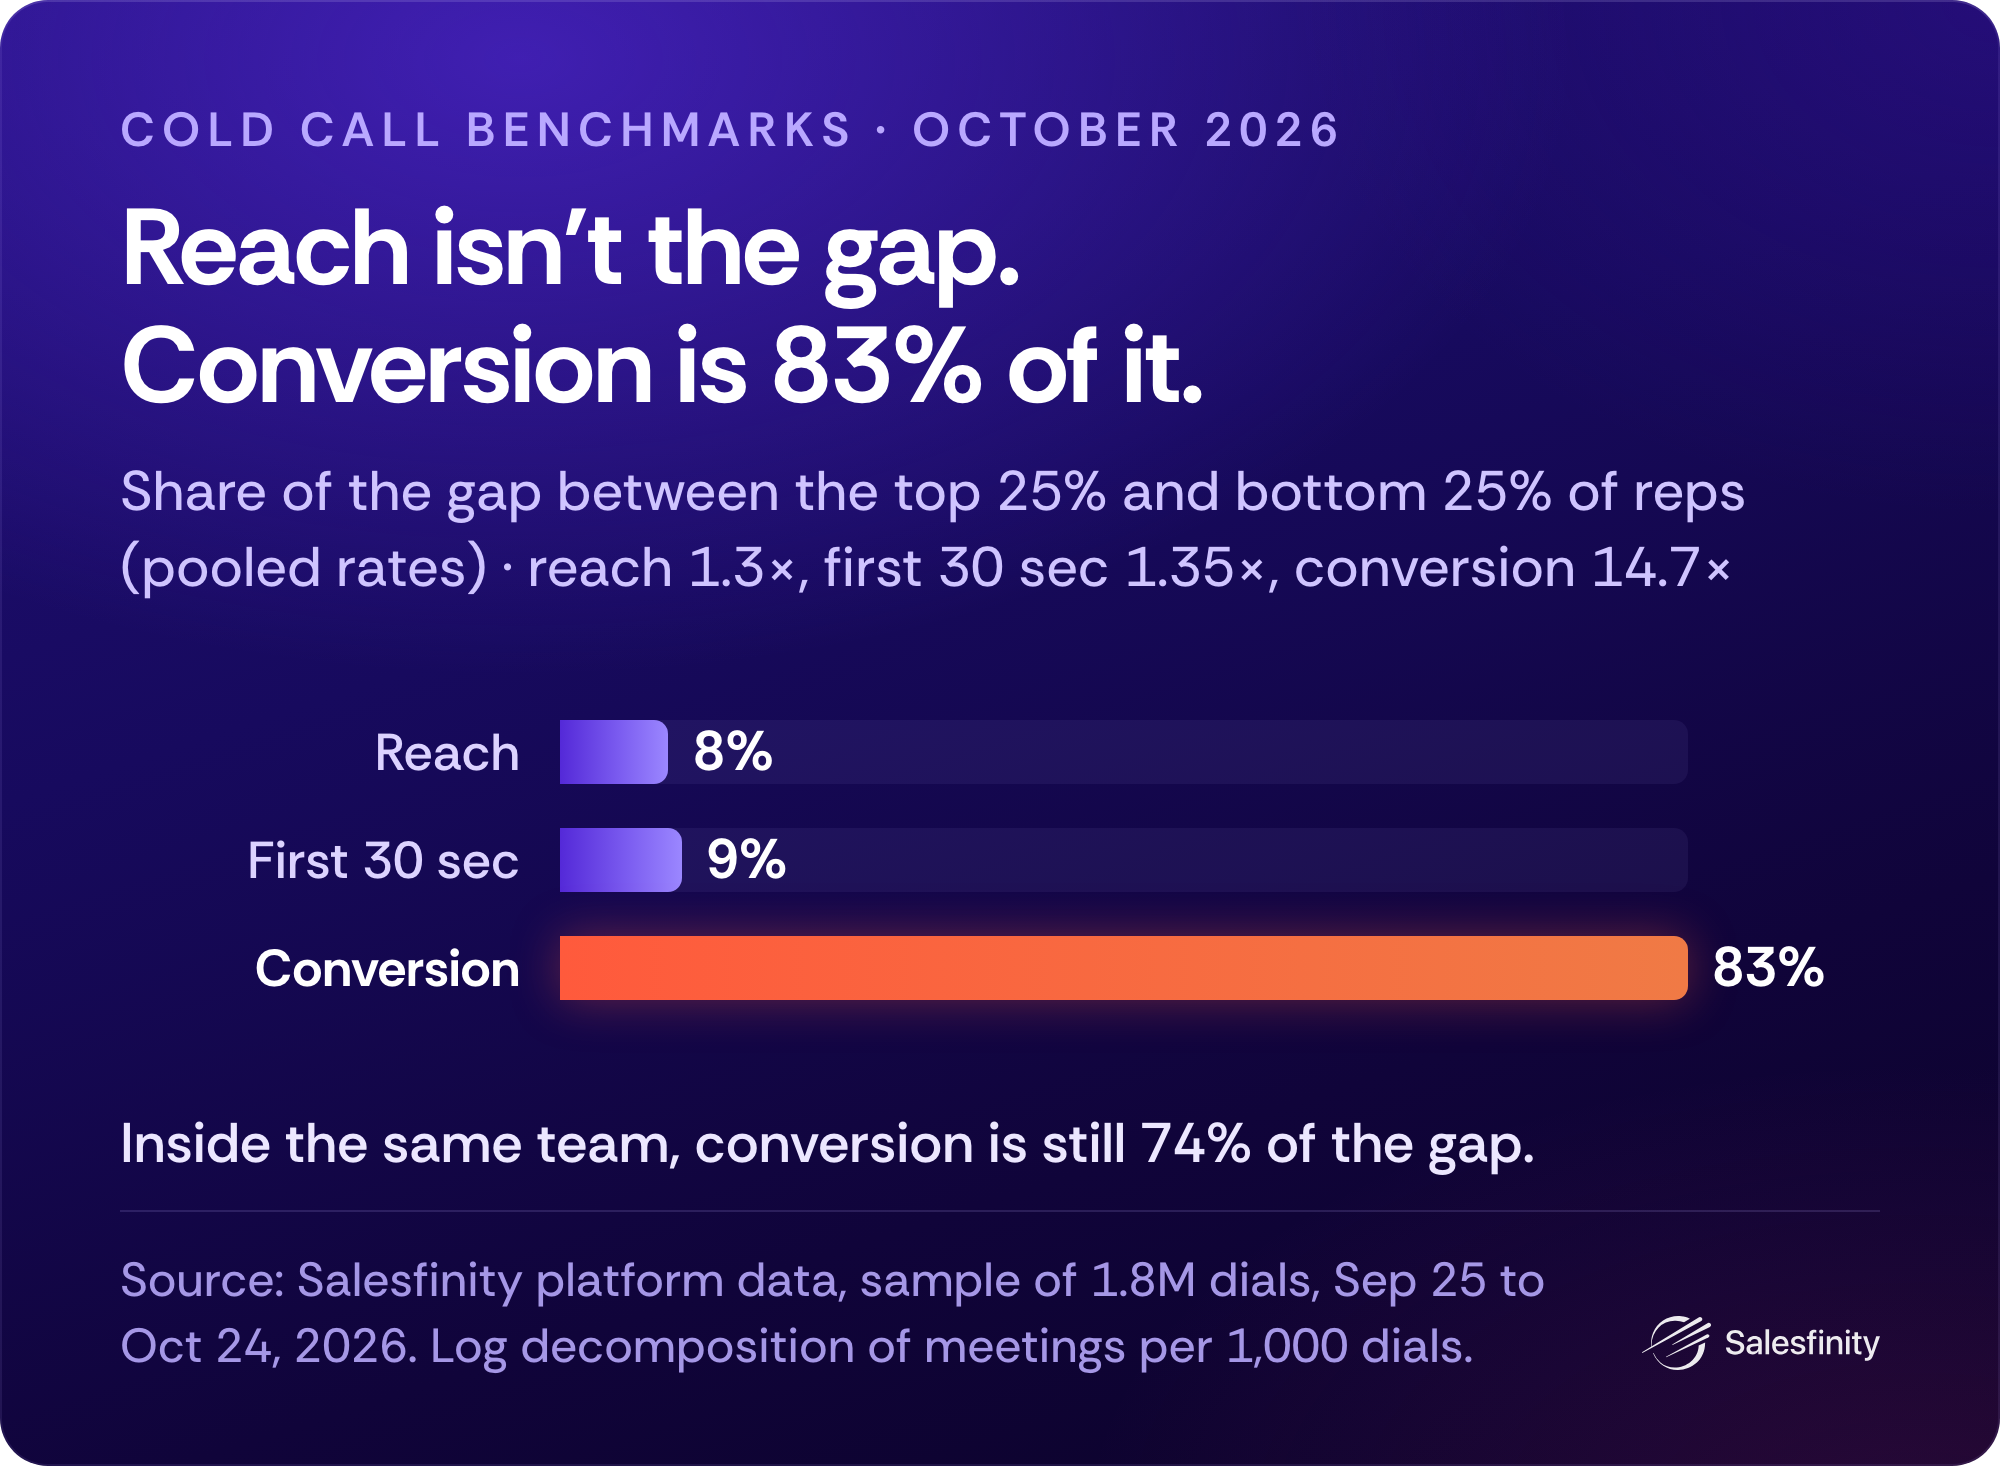
Meetings per dial is three rates multiplied together: connect rate, conversation rate and meeting rate. Compare the top and bottom quarters stage by stage:
Reach, or pickup (connect rate): top quarter 1.3x the bottom
The first 30 seconds (conversation rate): 1.35x
Conversion (meeting rate): 14.7x
Conversion's share holds however we cut it: 74% inside the same team, 81% without the reps who logged zero meetings, and 79% on teams that have both top and bottom reps.
What barely separates top reps from bottom reps:
Effort: 184 vs 221 dials a day, 4.6 vs 4.3 dialing hours, 16 vs 16 days.
Lines: 3.0 vs 3.2.
Reach, mostly: bottom-quarter reps connect on 9.8% of dials, above the middle half's 9.3% and not far behind the top quarter's 12.6%. It isn't effort, and it's mostly not access.
Unlabeled calls: bottom-quarter reps leave about as many connects without an outcome as top-quarter reps, so it isn't missing logs either.
Smart Dialing, AI summaries, follow-up dispositions, time on the platform: no meaningful difference between tiers.
Which suggests the difference is on the call, where coaching can reach it.
Hours multiply skill. Speed doesn't. On a rep's own heavy days, dials per hour rose 56% and meetings per dialing hour barely moved (0.19). Reps still booked 44% more meetings on heavy days, because those days were longer. Keep the hours. Cramming more dials into each hour buys nothing.
What Each Lever Is Worth
The conversation is the biggest lever on the board.
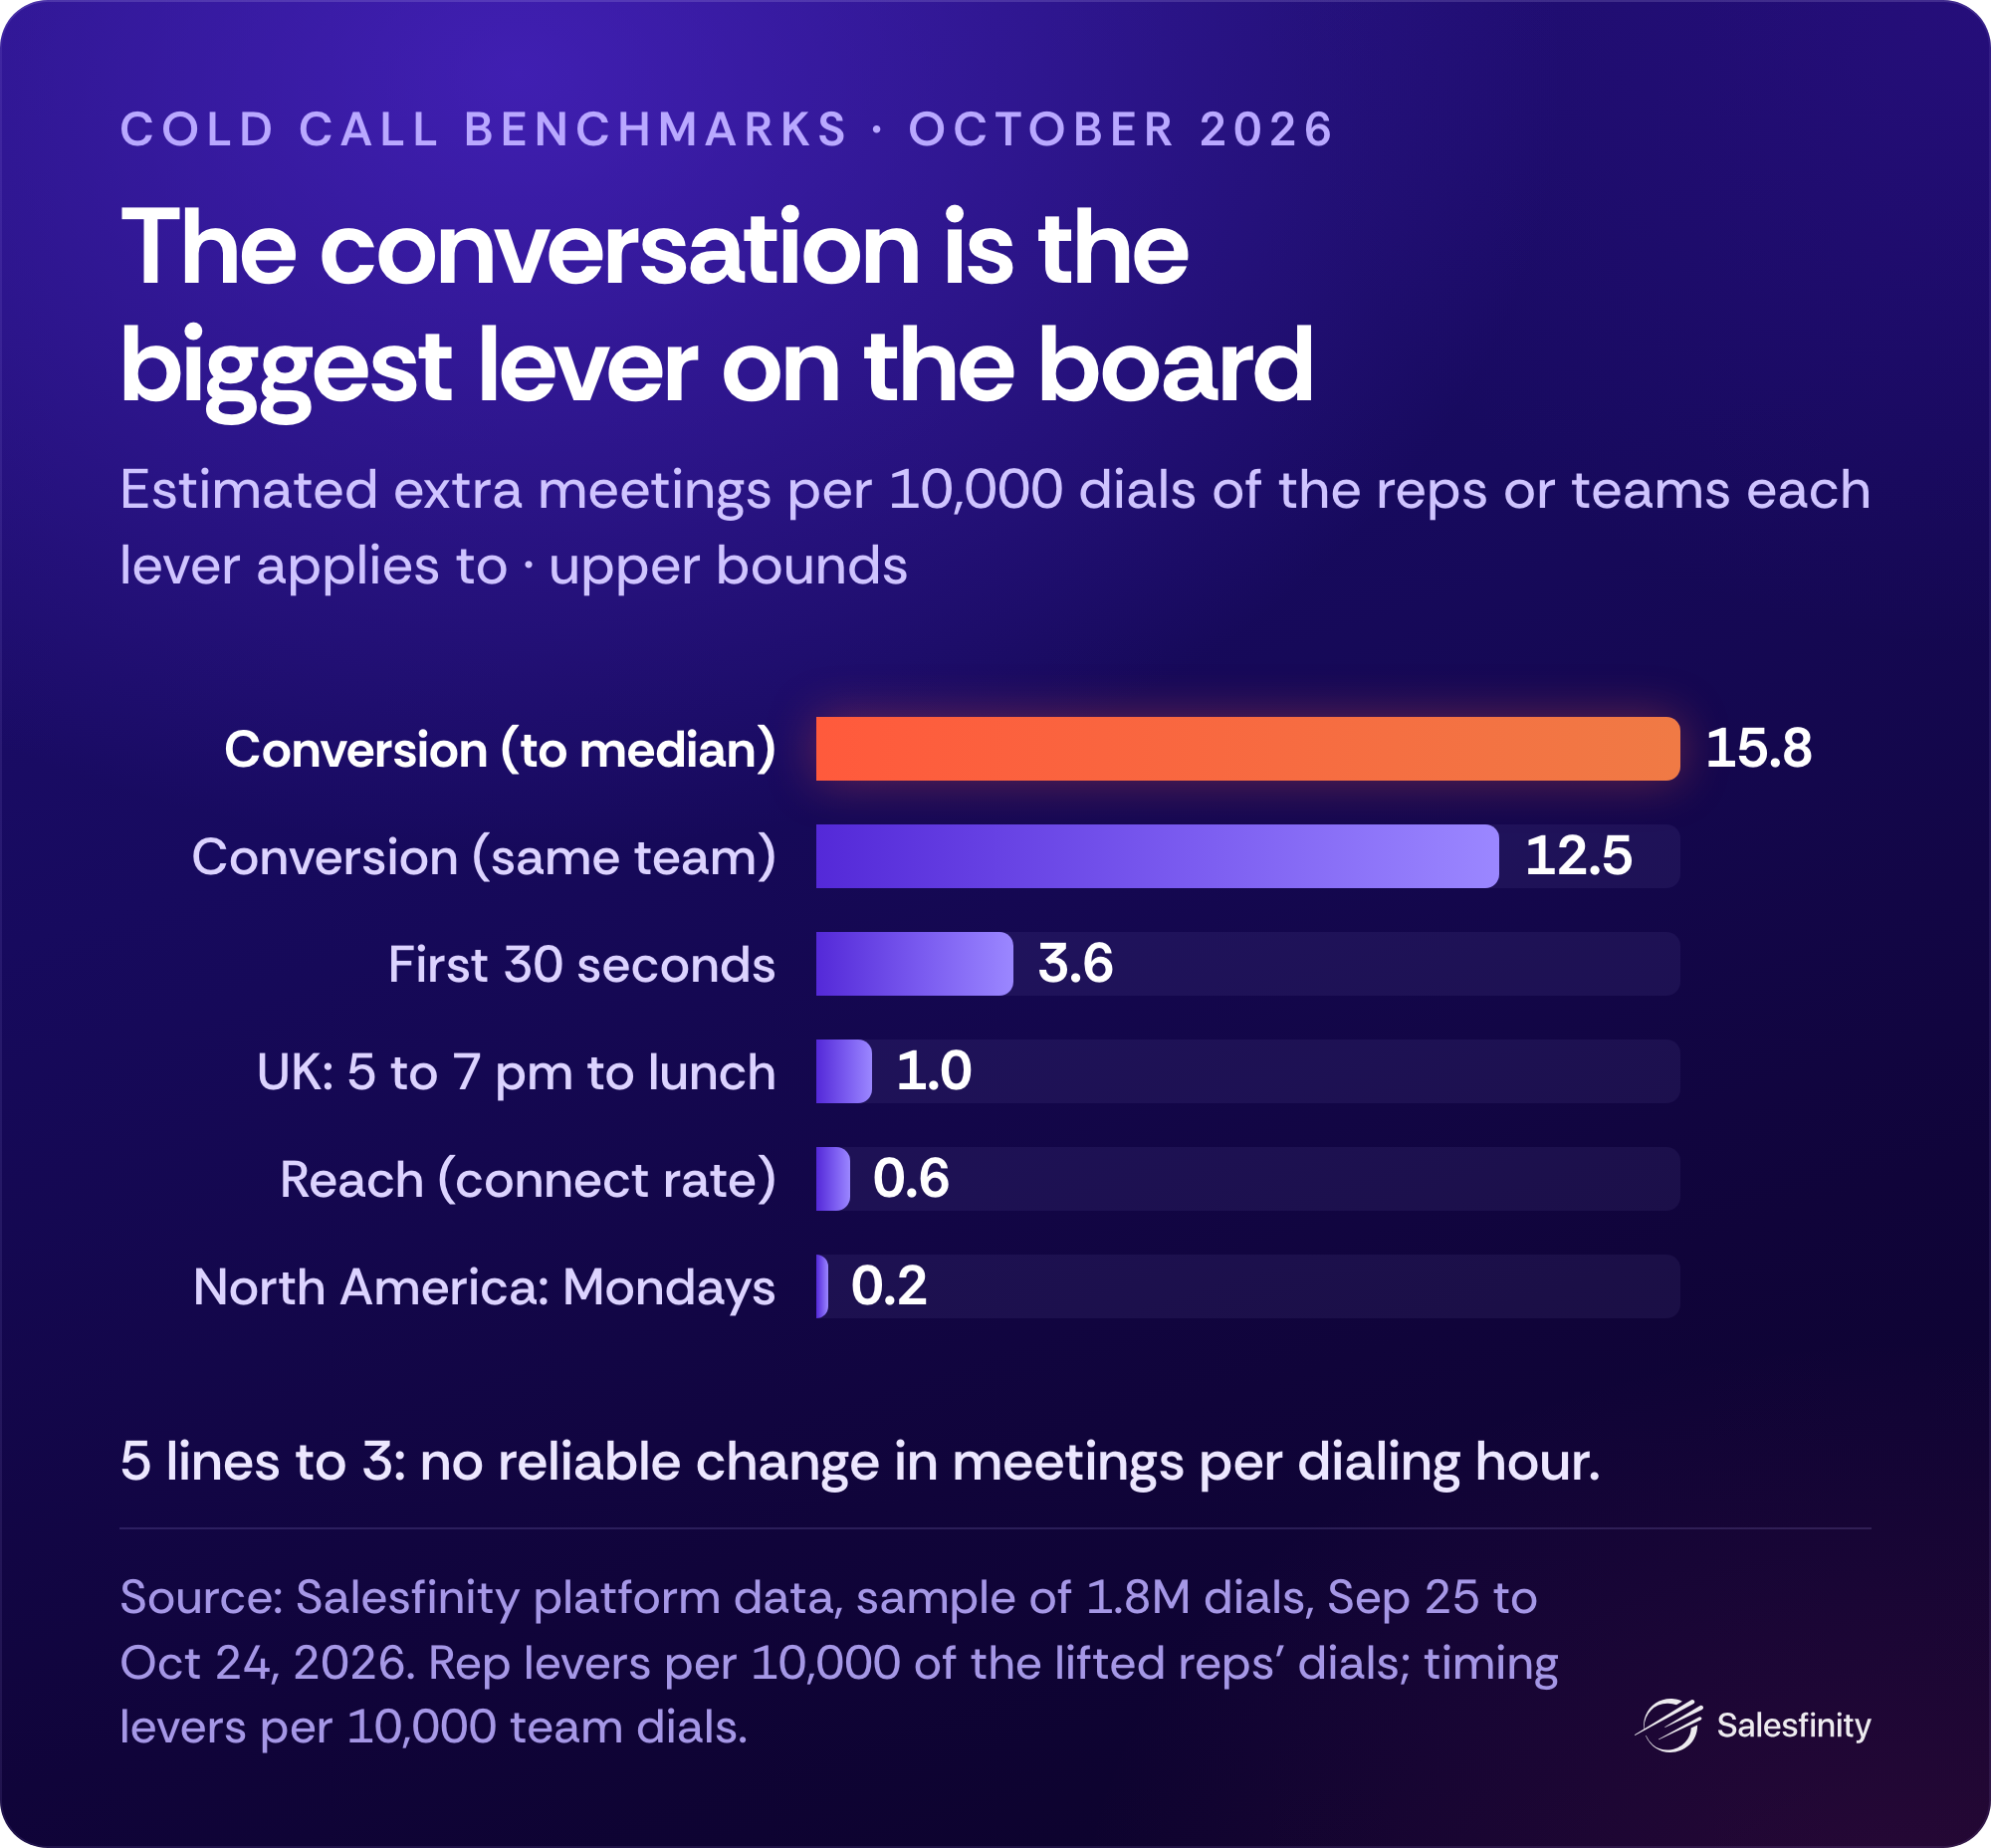
Conversion, bottom-quarter reps lifted to the median meeting rate: about +15.8 meetings per 10,000 of their dials.
Conversion, same team (below-median reps lifted to their own team's median meeting rate): about +12.5 per 10,000 of their dials.
The first 30 seconds (bottom quarter lifted to the median conversation rate): about +3.6.
UK & Ireland: a typical team's 5 to 7 pm dials moved to lunch: about +1.0 per 10,000 team dials (up to +4.3 if every after-5 pm dial moves and they're all UK prospects).
Reach (bottom quarter lifted to the median connect rate): about +0.6.
North America: more Monday dials (matching Monday's volume to Tuesday through Thursday): about +0.2 per 10,000 team dials.
5 lines to 3: no reliable change in meetings per dialing hour, but fewer dials per meeting (see Pickup Levers).
These are upper-bound estimates: they assume a lifted rep, or a moved dial, performs at the new rate. If you have one coaching hour this week, spend it on the conversation.
Find Your Leak
Find the stage where a rep (or the team) sits lowest on the card. That's the leak. Fix one at a time, in this order.
Leak 1: pickup (a team problem, usually the list). If your team's connect rate is below 6.4% for North American callers or 7.7% for UK & Ireland callers (the bottom quarter in each region), the leak may be the list.
Bad data (wrong contact, bad number and left company combined) above 32% of those connects means a bad list. Dirty-list teams connect on 7.0% of dials; clean-list teams (14% bad data or less) on 10.9%.
Gatekeeper share above about 5% means you're dialing switchboards. Of all the list signals, gatekeeper share is the one that tends to line up with fewer meetings (top-quarter teams 2.3%, bottom-quarter teams 4.7%).
Fix: send the counts, not complaints, to whoever owns the list. Ask for direct dials over switchboards. Don't coach a rep on a list problem: a dirty list lowers pickup however good the rep is.
Leak 2: the first 30 seconds. If a rep's conversation rate is under 31% of connects (29% for a team), check the line setting before you touch the opener. Pull 10 calls that ended under 10 seconds and ask one question: who spoke last? If the prospect said "Hello? ...hello?" into silence, that's the dialer. If they hung up after the rep's first sentence, that's the opener. If it was a voicemail greeting, ignore it.
Leak 3: the conversation (where 83% of the gap lives). If a rep's meeting rate is under 2.5% of conversations (2.3% for a team), the leak is what happens after the opener. Confirm it: reps in the bottom quarter on meeting rate log "not interested" on about half their conversations; the top quarter, on 30%. Then read it at the right level. If the whole team hears "no," it's the message or the targeting, and that's the VP's problem. If one rep hears it and their teammates on the same list don't, it's coaching. Fix: the 45-second review (Coaching Scripts).
Leak 4: busy, not booking. If a rep books fewer than about 0.4 meetings per 10 dialing hours while their dials per hour sit near the top of the team, the dials are there and the meetings aren't. Fix: keep the hours, drop the lines, give them a few seconds between calls, then run the 45-second review. This is not "dial less."
Pickup Levers
Five lines buys dials, not meetings. And UK & Ireland callers phoning UK prospects should stop at 5 pm.
Lines
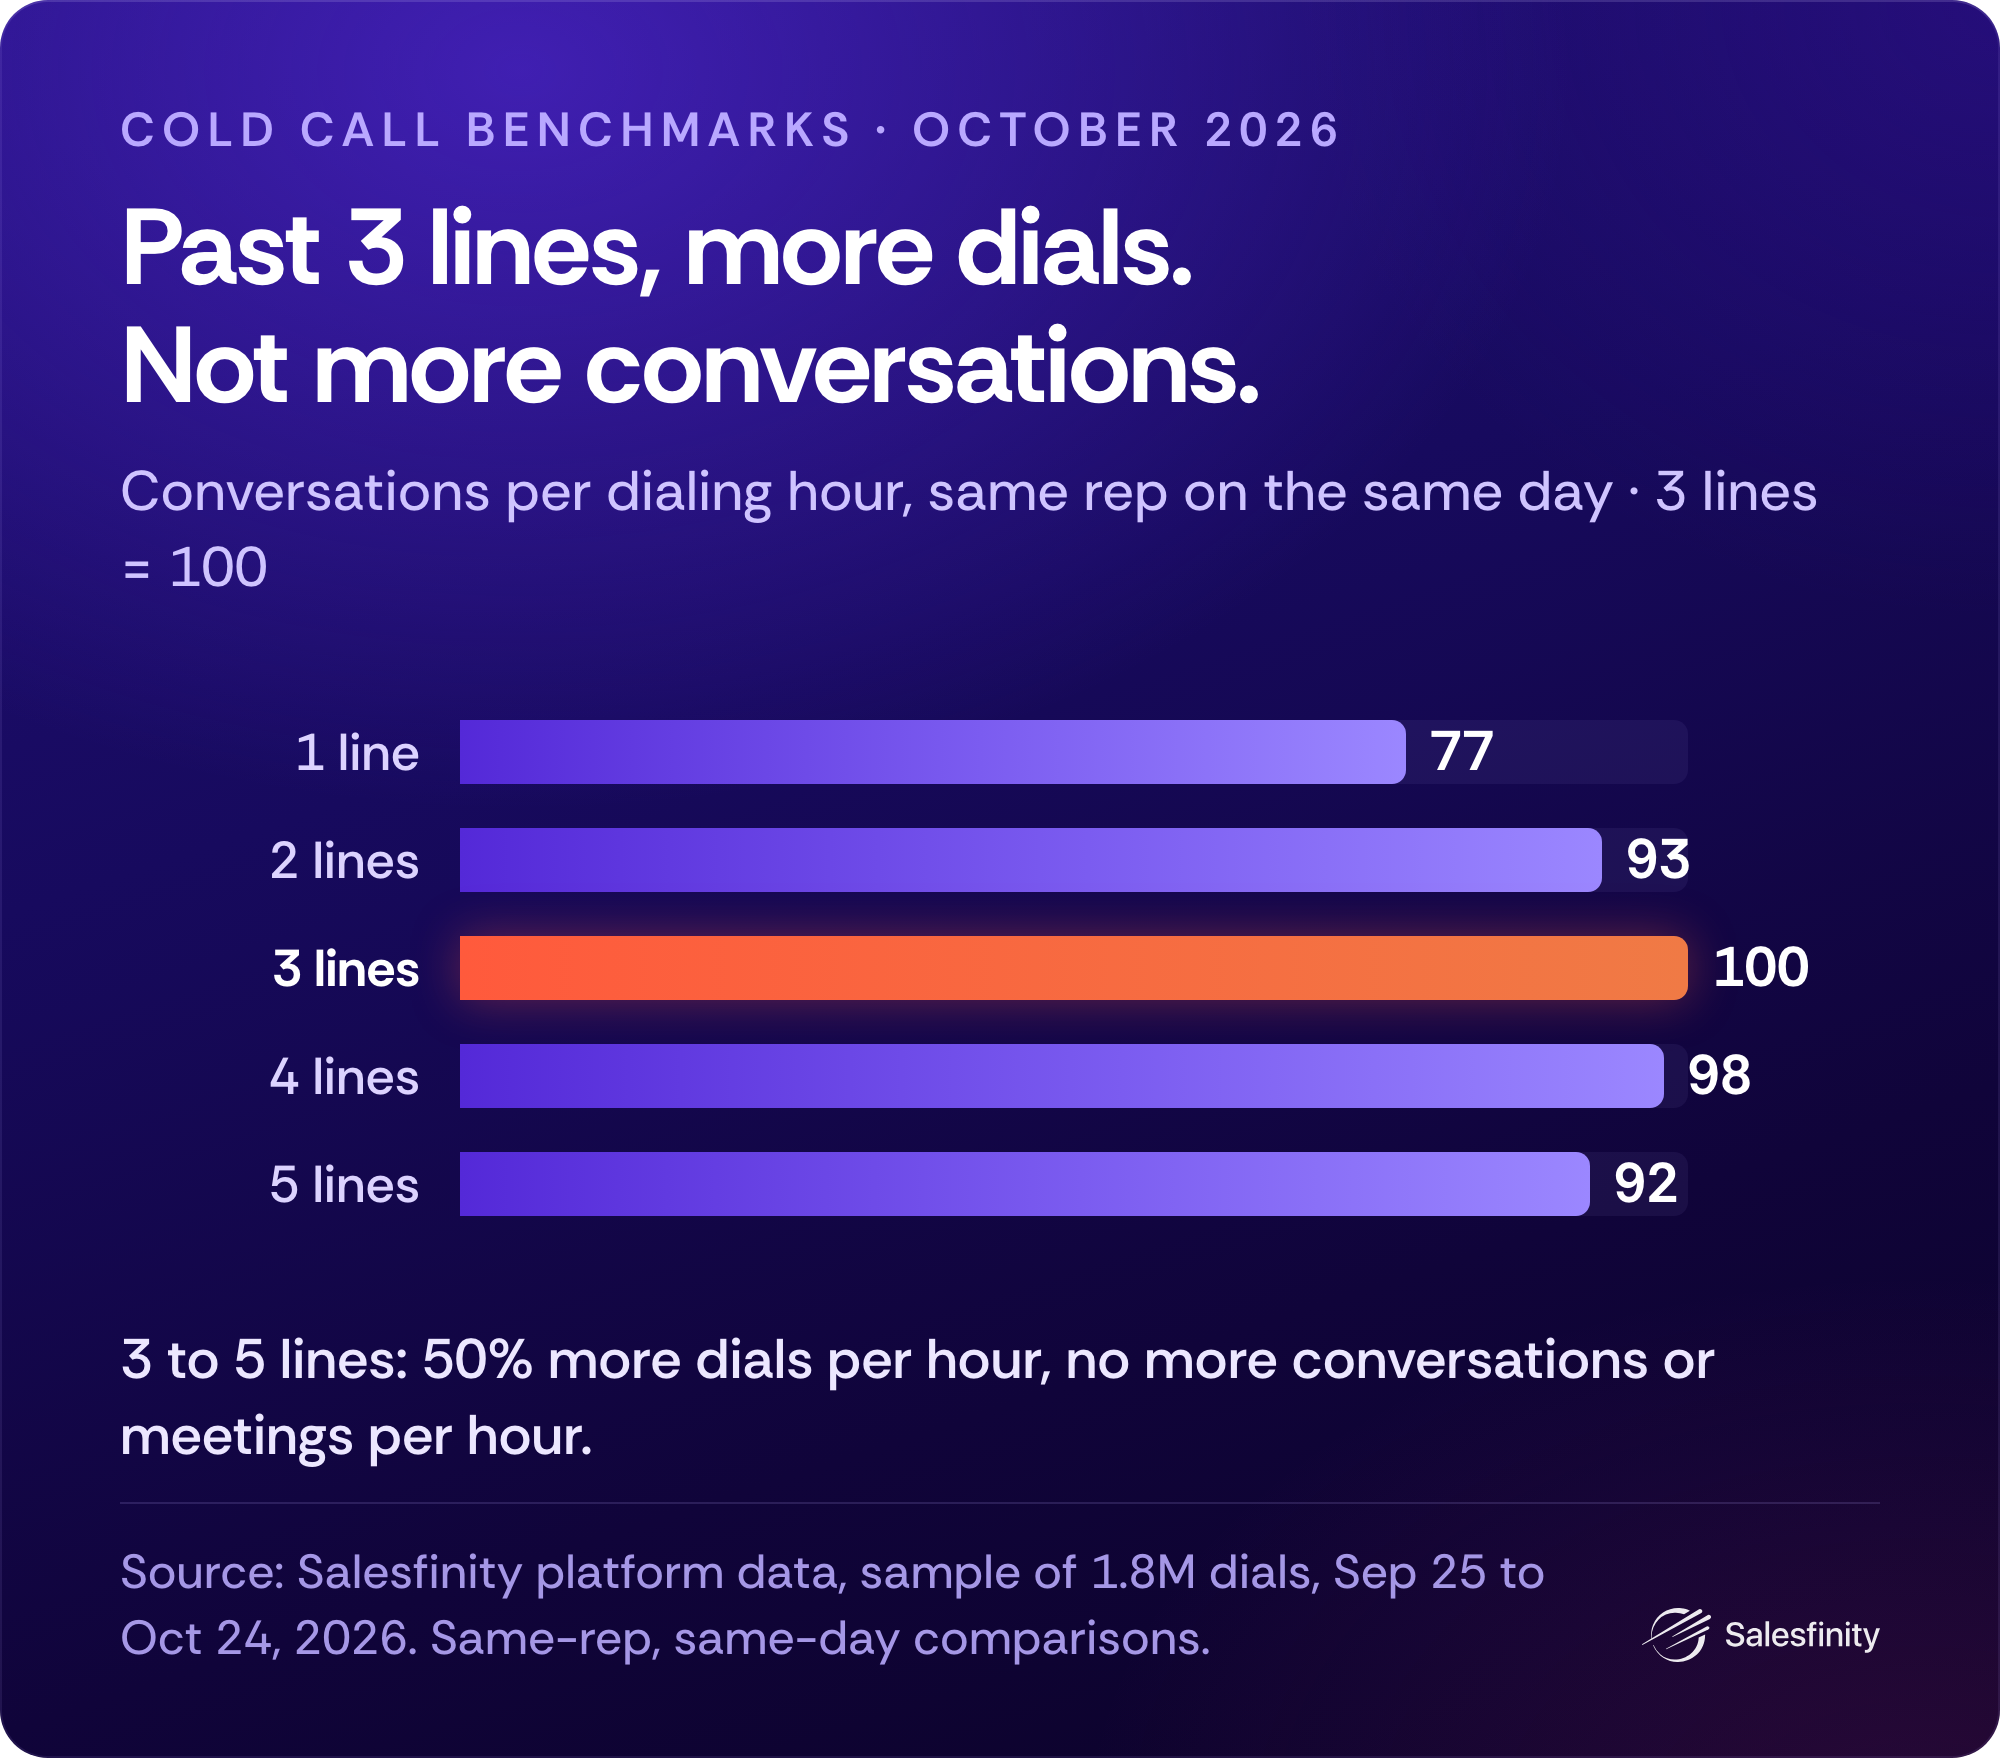
We sell a parallel dialer, so take this one from us: past 3 lines, more lines buy dials, not meetings. 38.5% of the dials in the sample go out on 5 lines. Comparing the same rep on the same day:
1 to 3 lines: 31% more conversations per dialing hour.
3 to 5 lines: 50% more dials per hour and 7% more connects, but no more conversations per hour (0.92x), because a smaller share of connects makes it past 30 seconds (0.85x).
Meetings: no more per hour on 5 lines than on 3 (0.88x, with a 95% range of 0.62 to 1.15), so each meeting costs about 1.6x the dials. Across the whole month the same reps booked fewer per hour on 5 lines (0.68x), but that comparison mixes in list and timing.
We’d recommend a maximum of 2-3 parallel lines or power dialing for max effectiveness per hour
The clock
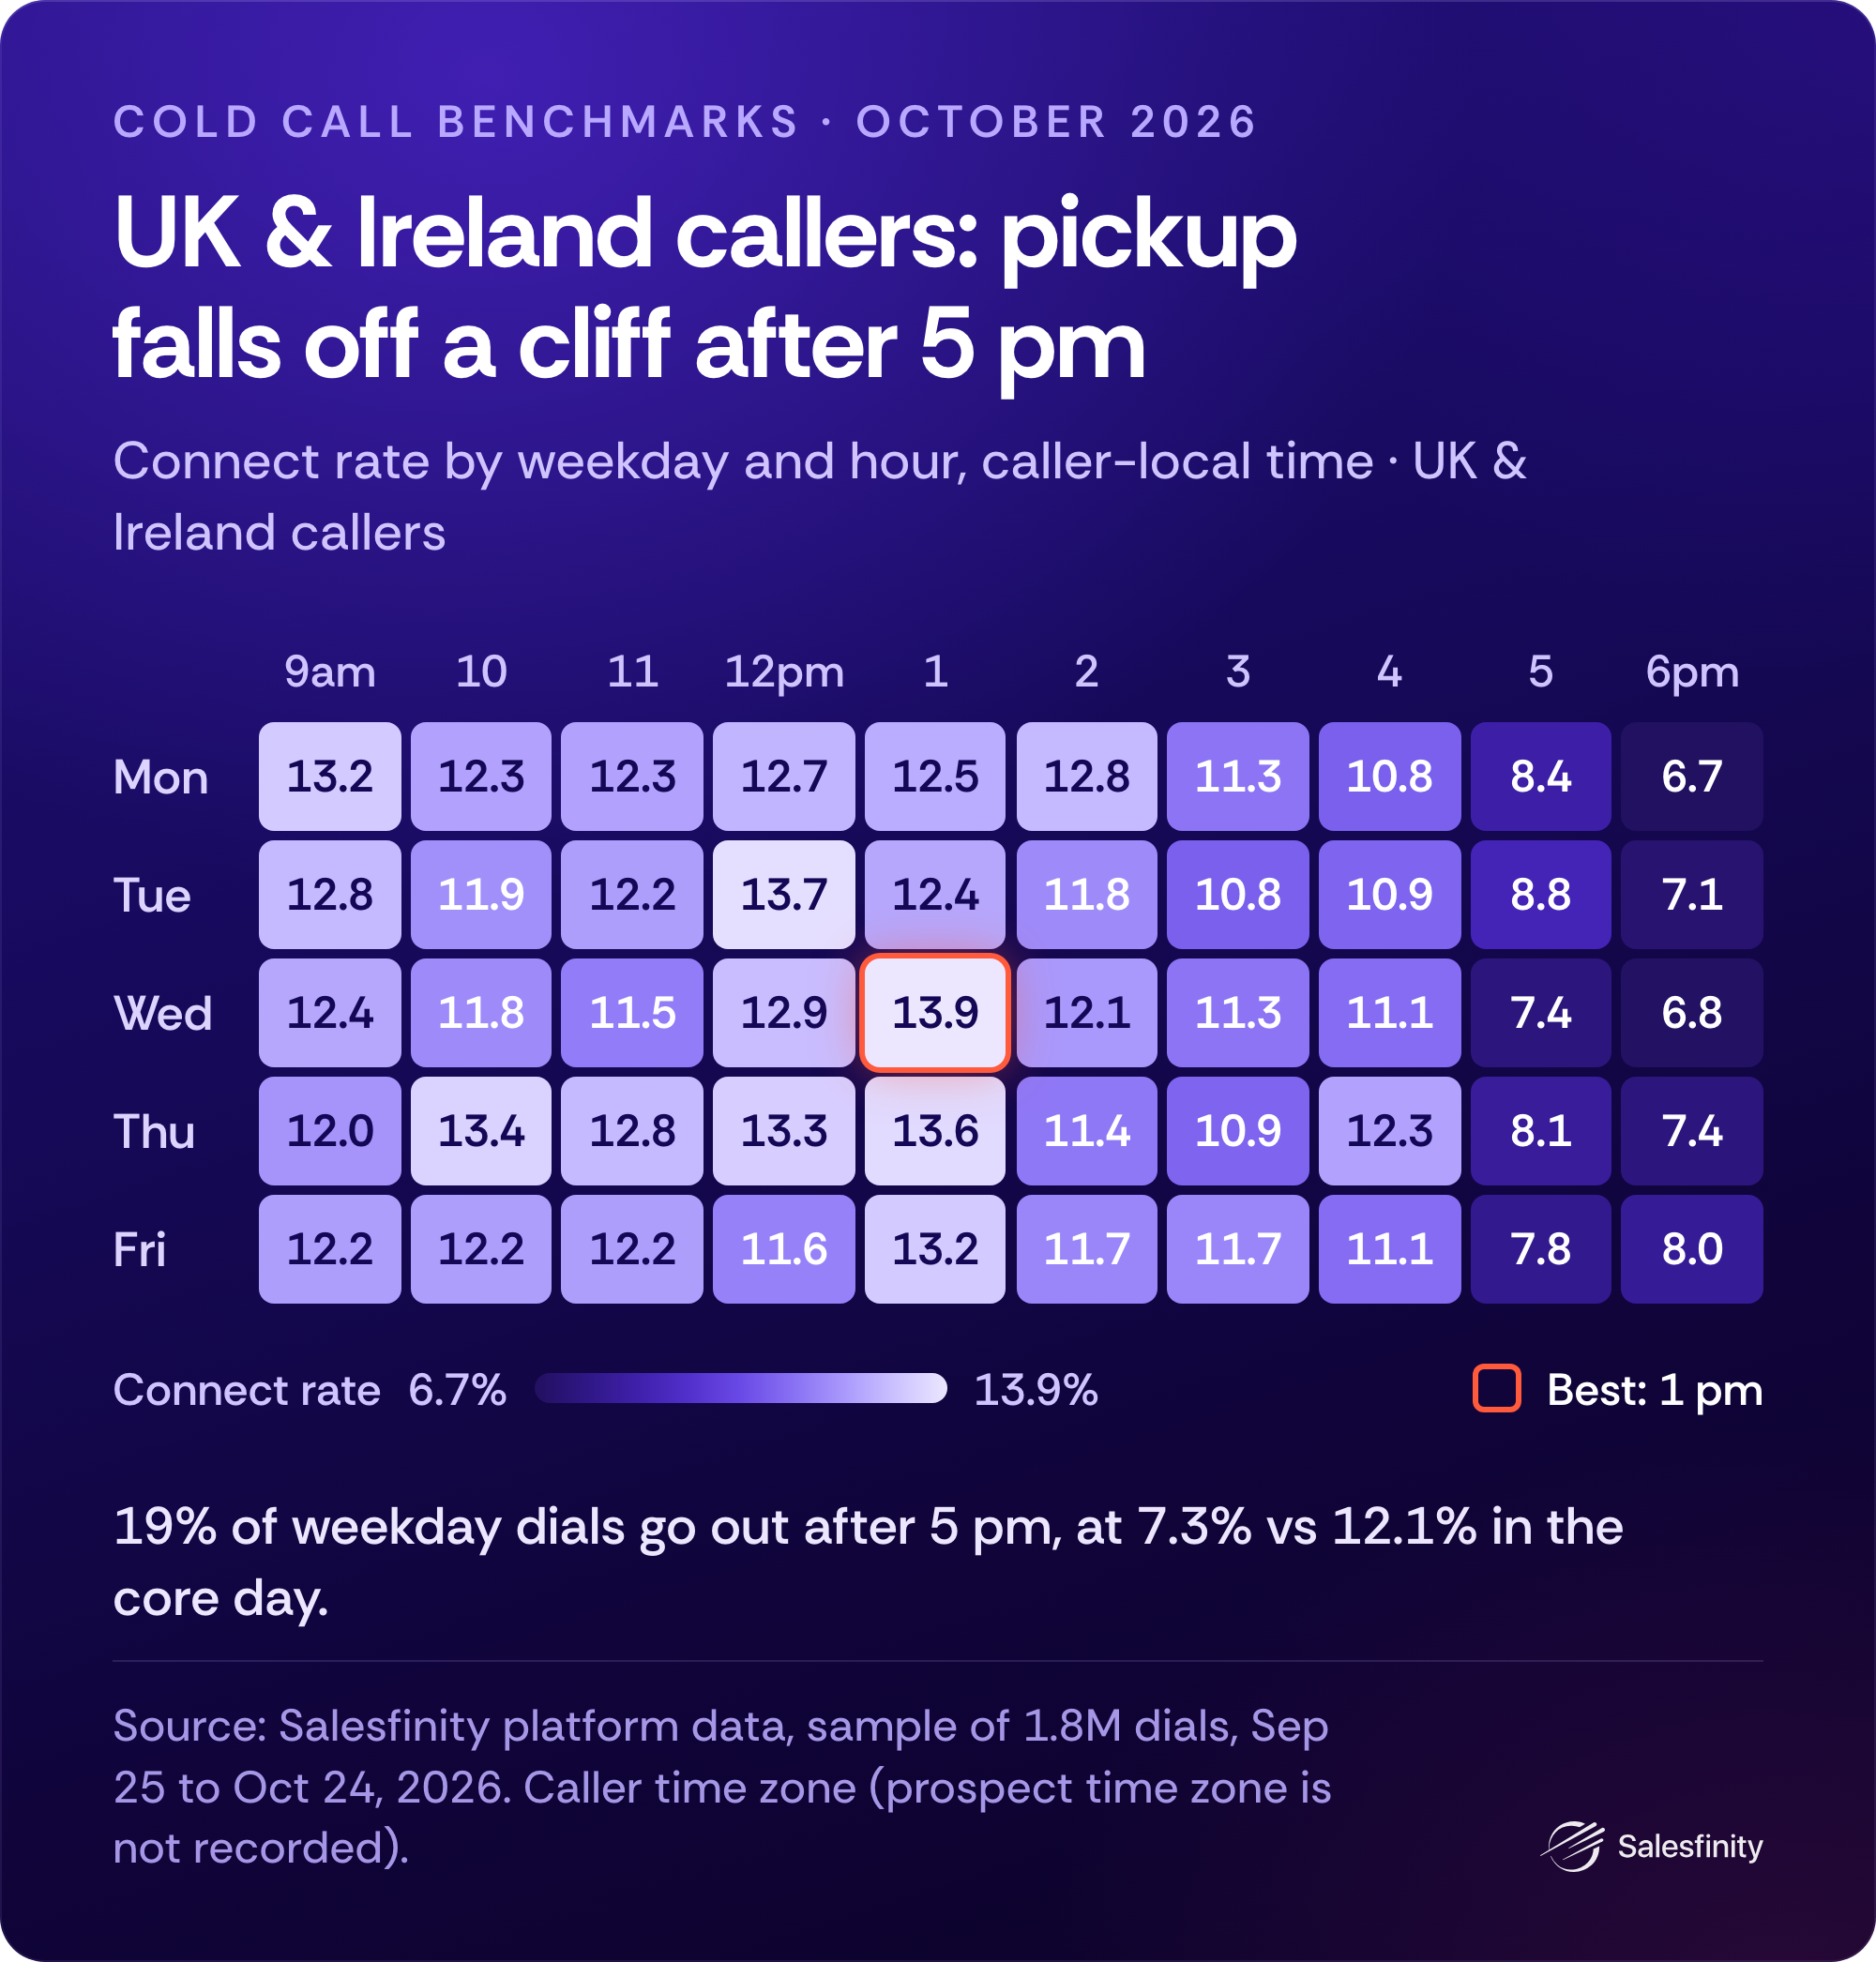
UK & Ireland callers: 19.3% of weekday dials go out after 5 pm, at a 7.3% connect rate, against 12.1% from 9 to 5. The same rep connects 22% less at 5 pm and 33% less at 6 pm than their own average.
1 pm is the best core hour (1.08x for the same rep) and gets 5.2% of dials, probably because it's lunch. Stagger lunch.
The estimate: every 1,000 dials moved from 5 to 7 pm into 12 to 2 pm adds about 39 connects, 25 conversations and 1 meeting. Small, but free.
The caveat: the data sees the caller's clock, not the prospect's. If your UK-based reps are calling UK prospects after 5 pm, move those dials to lunch. If they're calling North America, grade them against the North American rate.
North America: the hour barely matters. For the same rep, the whole core day sits within about 5%. Monday is the exception: North American callers book best on Mondays (3.90 meetings per 1,000 dials, 1.15x for the same rep) and give Mondays the smallest share of their dials (16.7%). One of this window's four Mondays was a US holiday, so treat it as a nudge.
Dialing mode: a trade, not a free lunch
For the same rep, Smart Dialing raised connect rate 11% and conversation rate 10%, and cut dials per hour 15%. Use it on a small, high-value list where every number matters. We recommend using Salesfinity’s SmartDialing and letting our system adjust parallel calls based on contact’s likeliness to pick up.
Conversion Levers
Most connects are gone by second 30. What happens after that decides who books.
The first 30 seconds
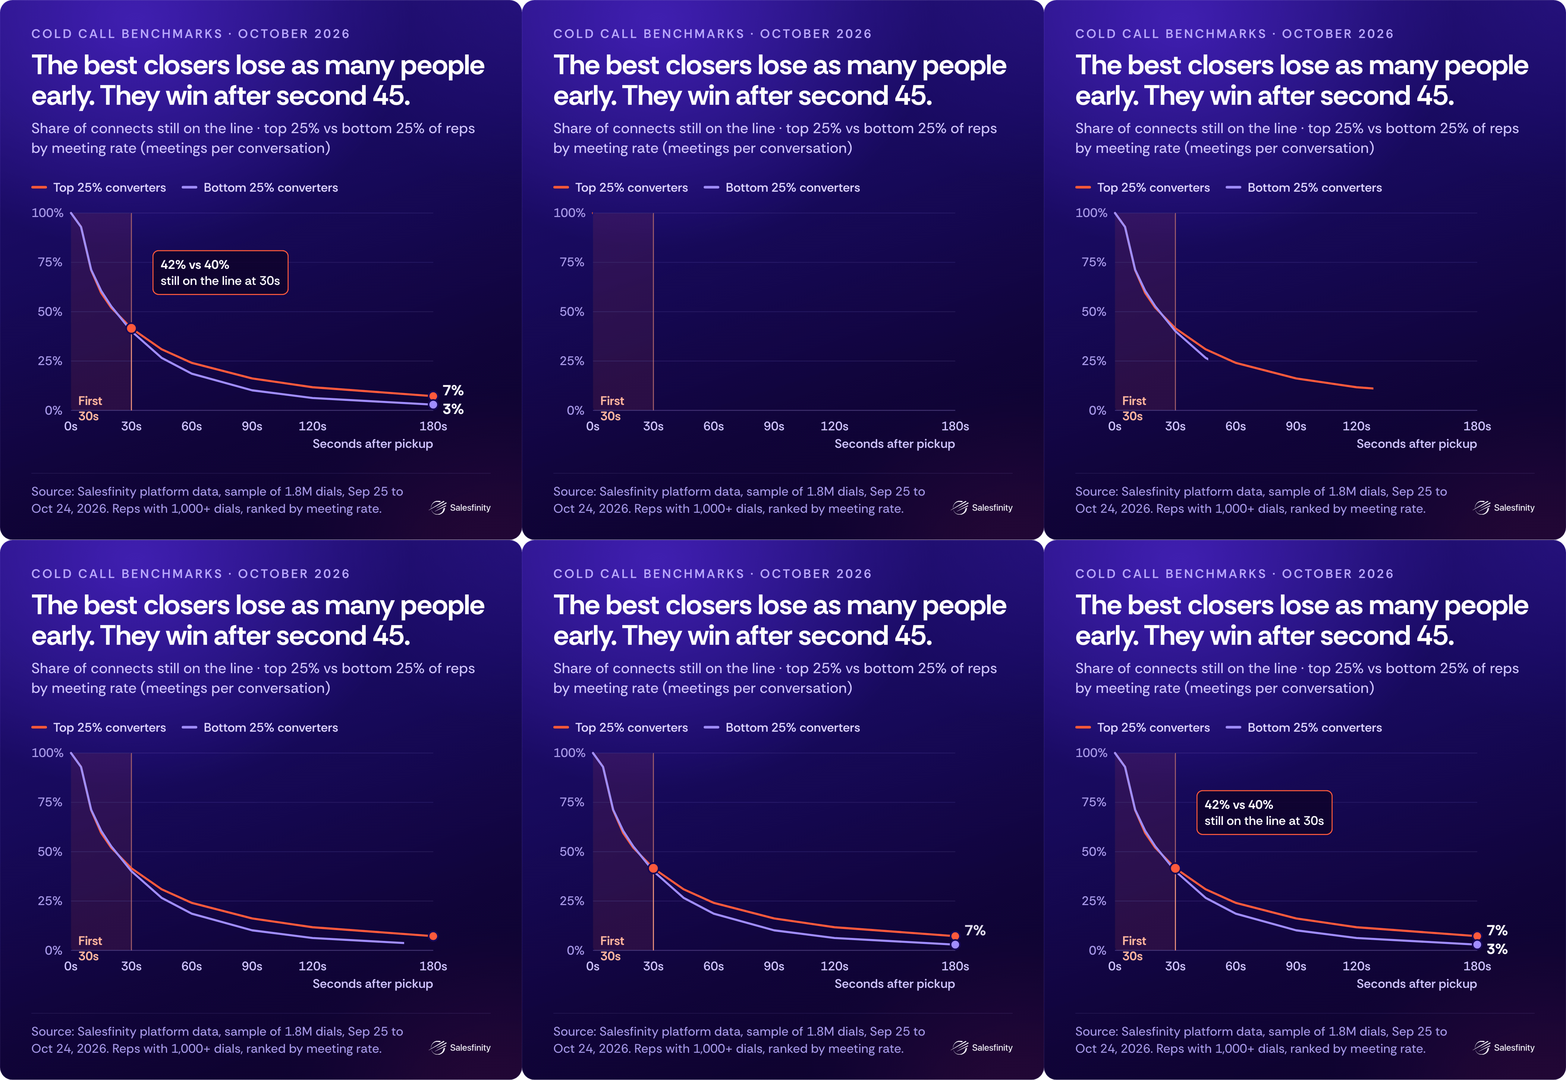
Rank reps by meeting rate, and the top and bottom 25% look identical for the first 30 seconds: 42% vs 40% of connects still on the line at 30 seconds. The curves split after 45 seconds: 24% vs 19% at a minute, 12% vs 6% at two.
Ranked by meetings per 1,000 dials instead, the top quarter does keep more connects past 30 seconds (47% vs 35%): that's the 9% of the gap the first 30 seconds explain. But the best closers aren't better openers. The opener gets you the conversation. It doesn't decide who books. That happens later in the call.
Call length
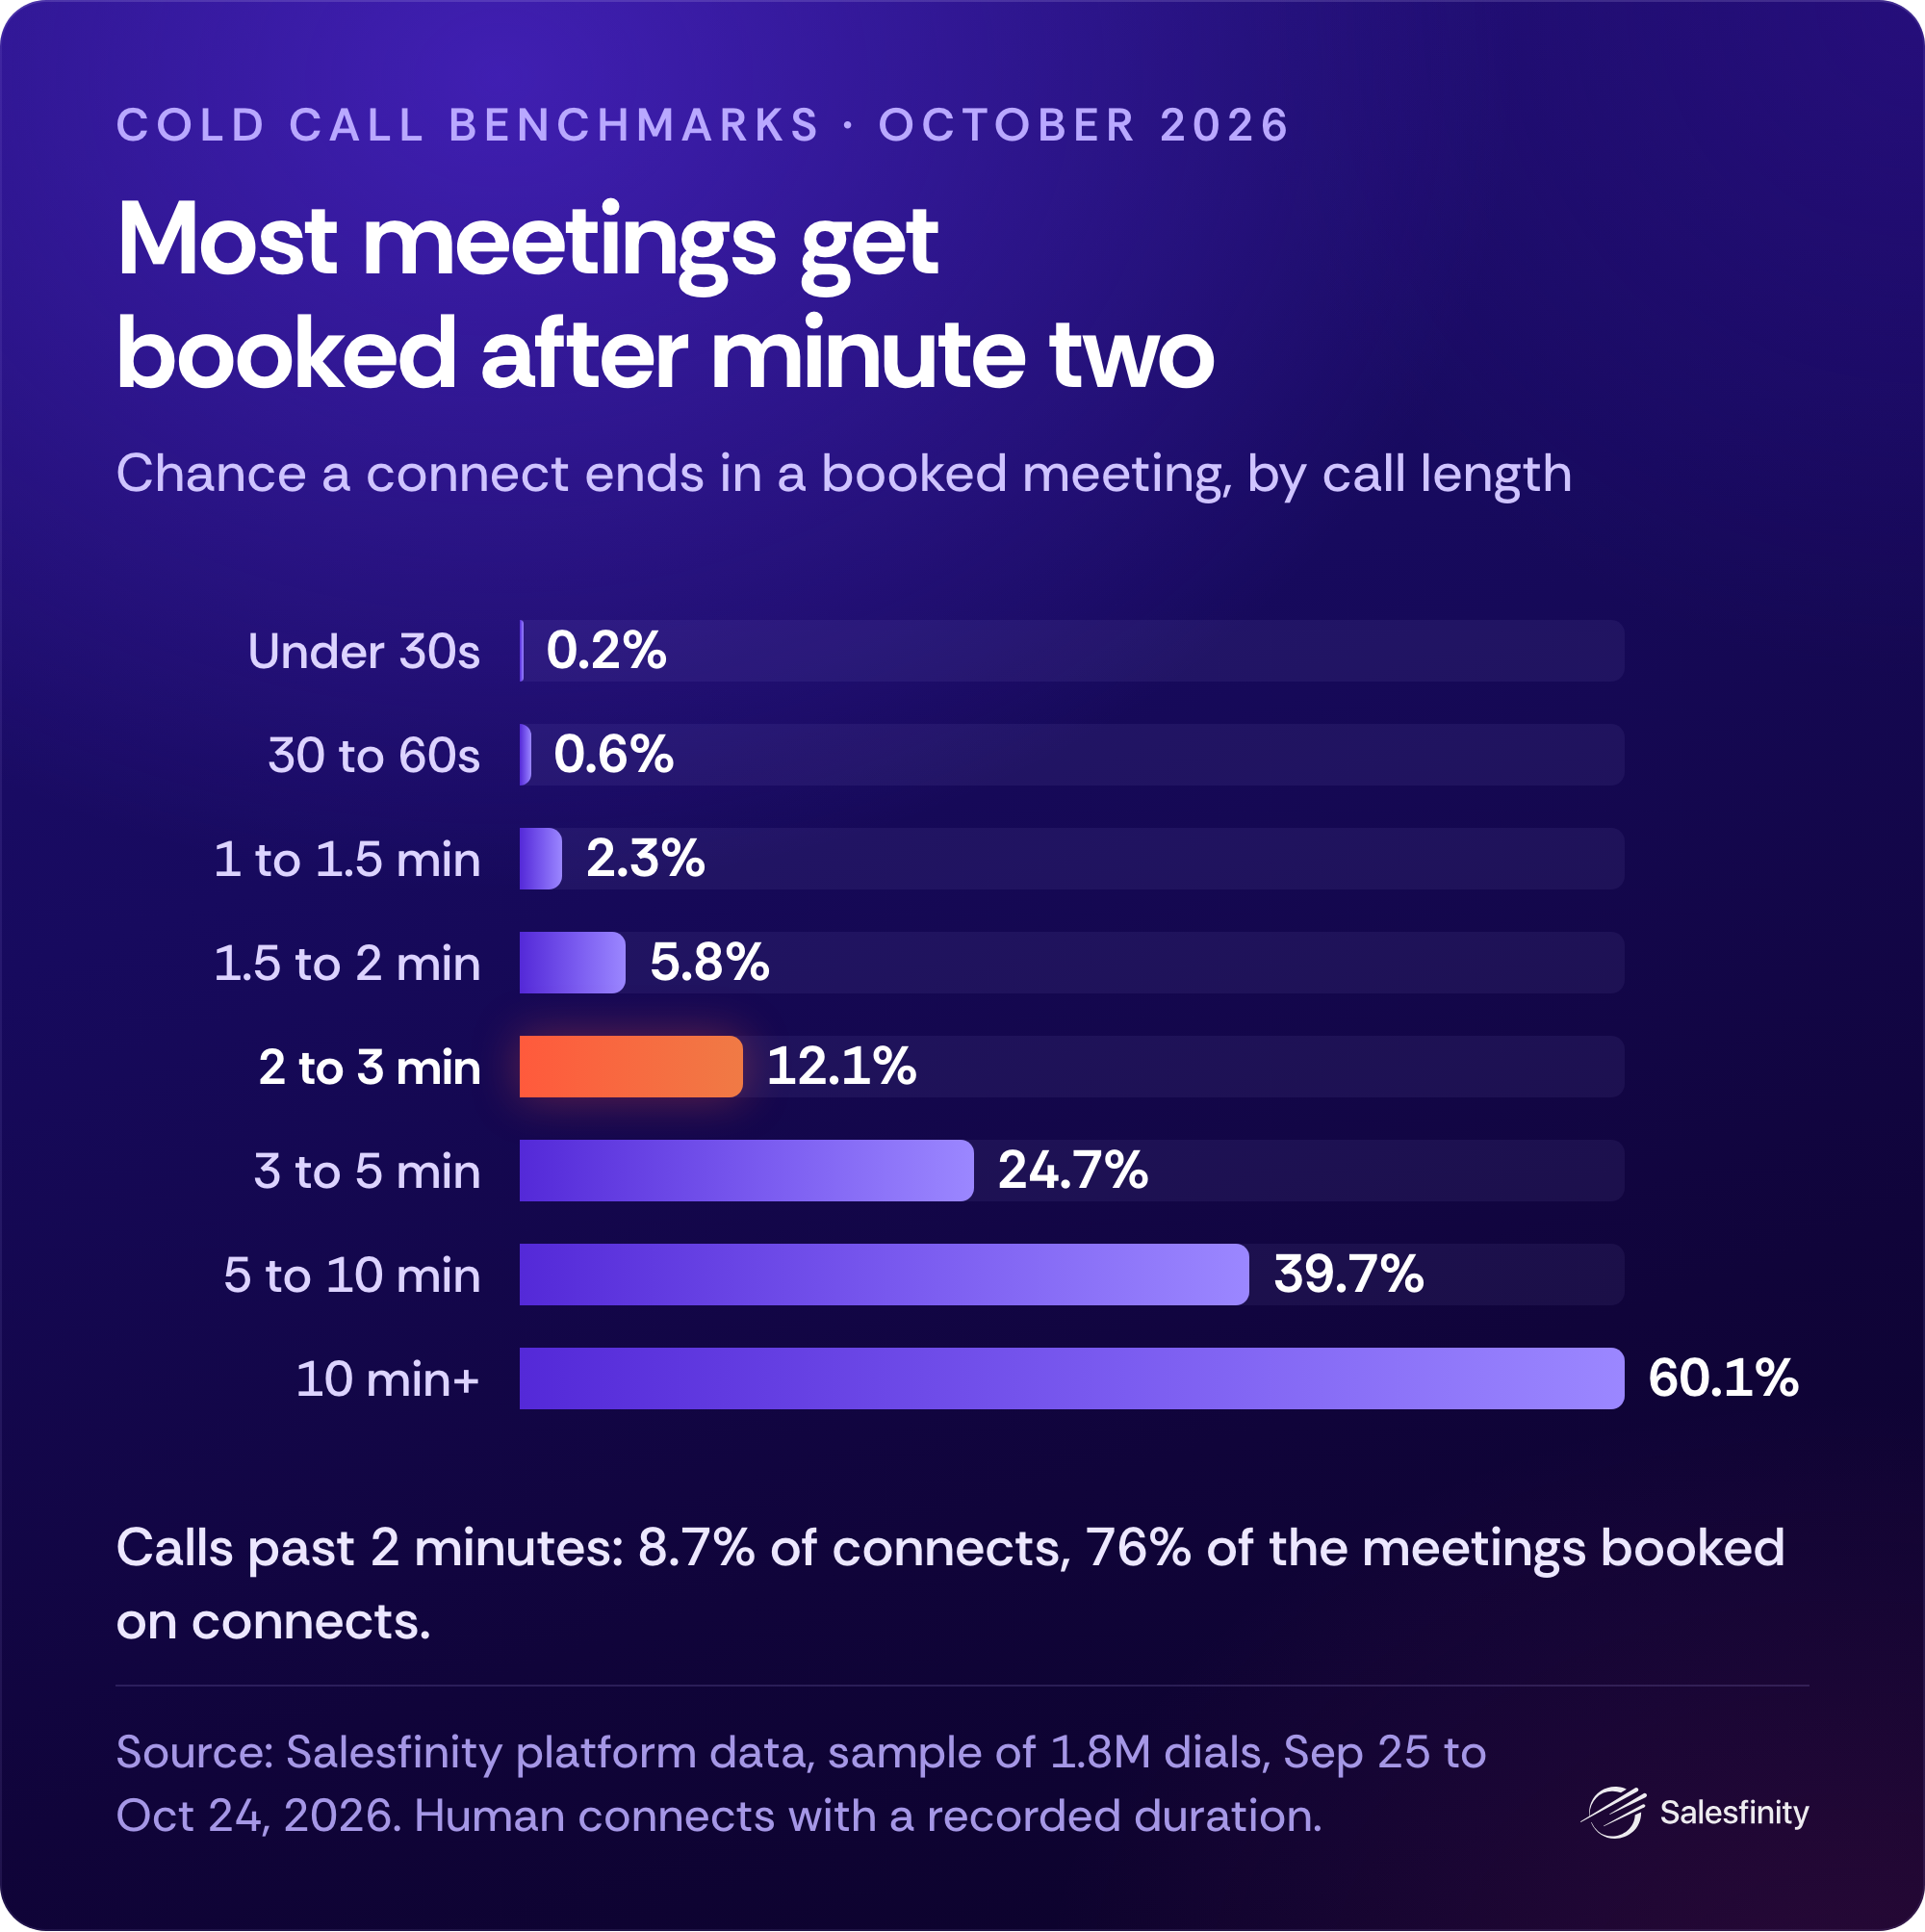
Calls past 2 minutes are 8.7% of connects and hold 76% of the meetings booked on connects.
A booked call runs a median 224 seconds. A conversation that doesn't book: 59 seconds.
Don't set a talk-time target. Calls get long because the prospect is interested and you're agreeing on a time, not the other way around. Outside booked calls, the top 25% by meeting rate talk only a little longer than the bottom 25% (94 vs 83 seconds on average). Use length as a symptom: if your reps' conversations average under about 75 seconds, prospects are leaving before discovery starts.
How conversations end
Of conversations that reached the right person and got an outcome logged:
48.0% not interested
20.6% call me back later
10.5% meeting
9.7% send me an email
8.8% don't call again
Half of all "not interested" outcomes land between 20 and 60 seconds, right after the opener.
Psychology Corner: a fast "not interested" is rarely a verdict on your product. It's a verdict on the next 30 seconds of their day. Our read, not a finding: ask how they handle this today before you say what you sell. A question buys time a pitch can't.
Methodology & Notes
We publish these so you can pressure-test us.
Window: Sep 25 to Oct 24, 2026 (30 days, US Eastern days). Last month: Aug 26 to Sep 24. The July issue's window: Jun 17 to Jul 16.
Sample: 1.8 million dials logged on the Salesfinity platform by B2B sales teams, most of them calling from North America or the UK & Ireland. Tiers use a graded sample of about 350 reps.
The gap: "21x" compares the top and bottom quarters' total meetings. The stage breakdown uses pooled rates (top quarter 9.22 meetings per 1,000 dials vs 0.36, a 25.6x ratio of rates).
Comparisons: "same rep" results compare each rep with themselves, on the same day or across the month. That removes differences in lists and teams, but not the reasons reps change settings. Everything here is association, not proof of cause.
Time zones: the data records the caller's time zone, not the prospect's. Time-of-day results use North American and UK & Ireland callers only.
Skill vs luck: reps ranked on Sep 25 to Oct 9 and measured on Oct 10 to Oct 24 (reps with 400+ dials in each half): the top quarter's second-half rate was 9.3x the bottom quarter's (95% range 6.4x to 14.0x).
Your move. Reply with your team's meetings per 1,000 dials and we'll tell you your tier. Then forward this to whoever sets your dial quota.
The Call Report is published by Cold Call Benchmarks at Salesfinity.ai.