

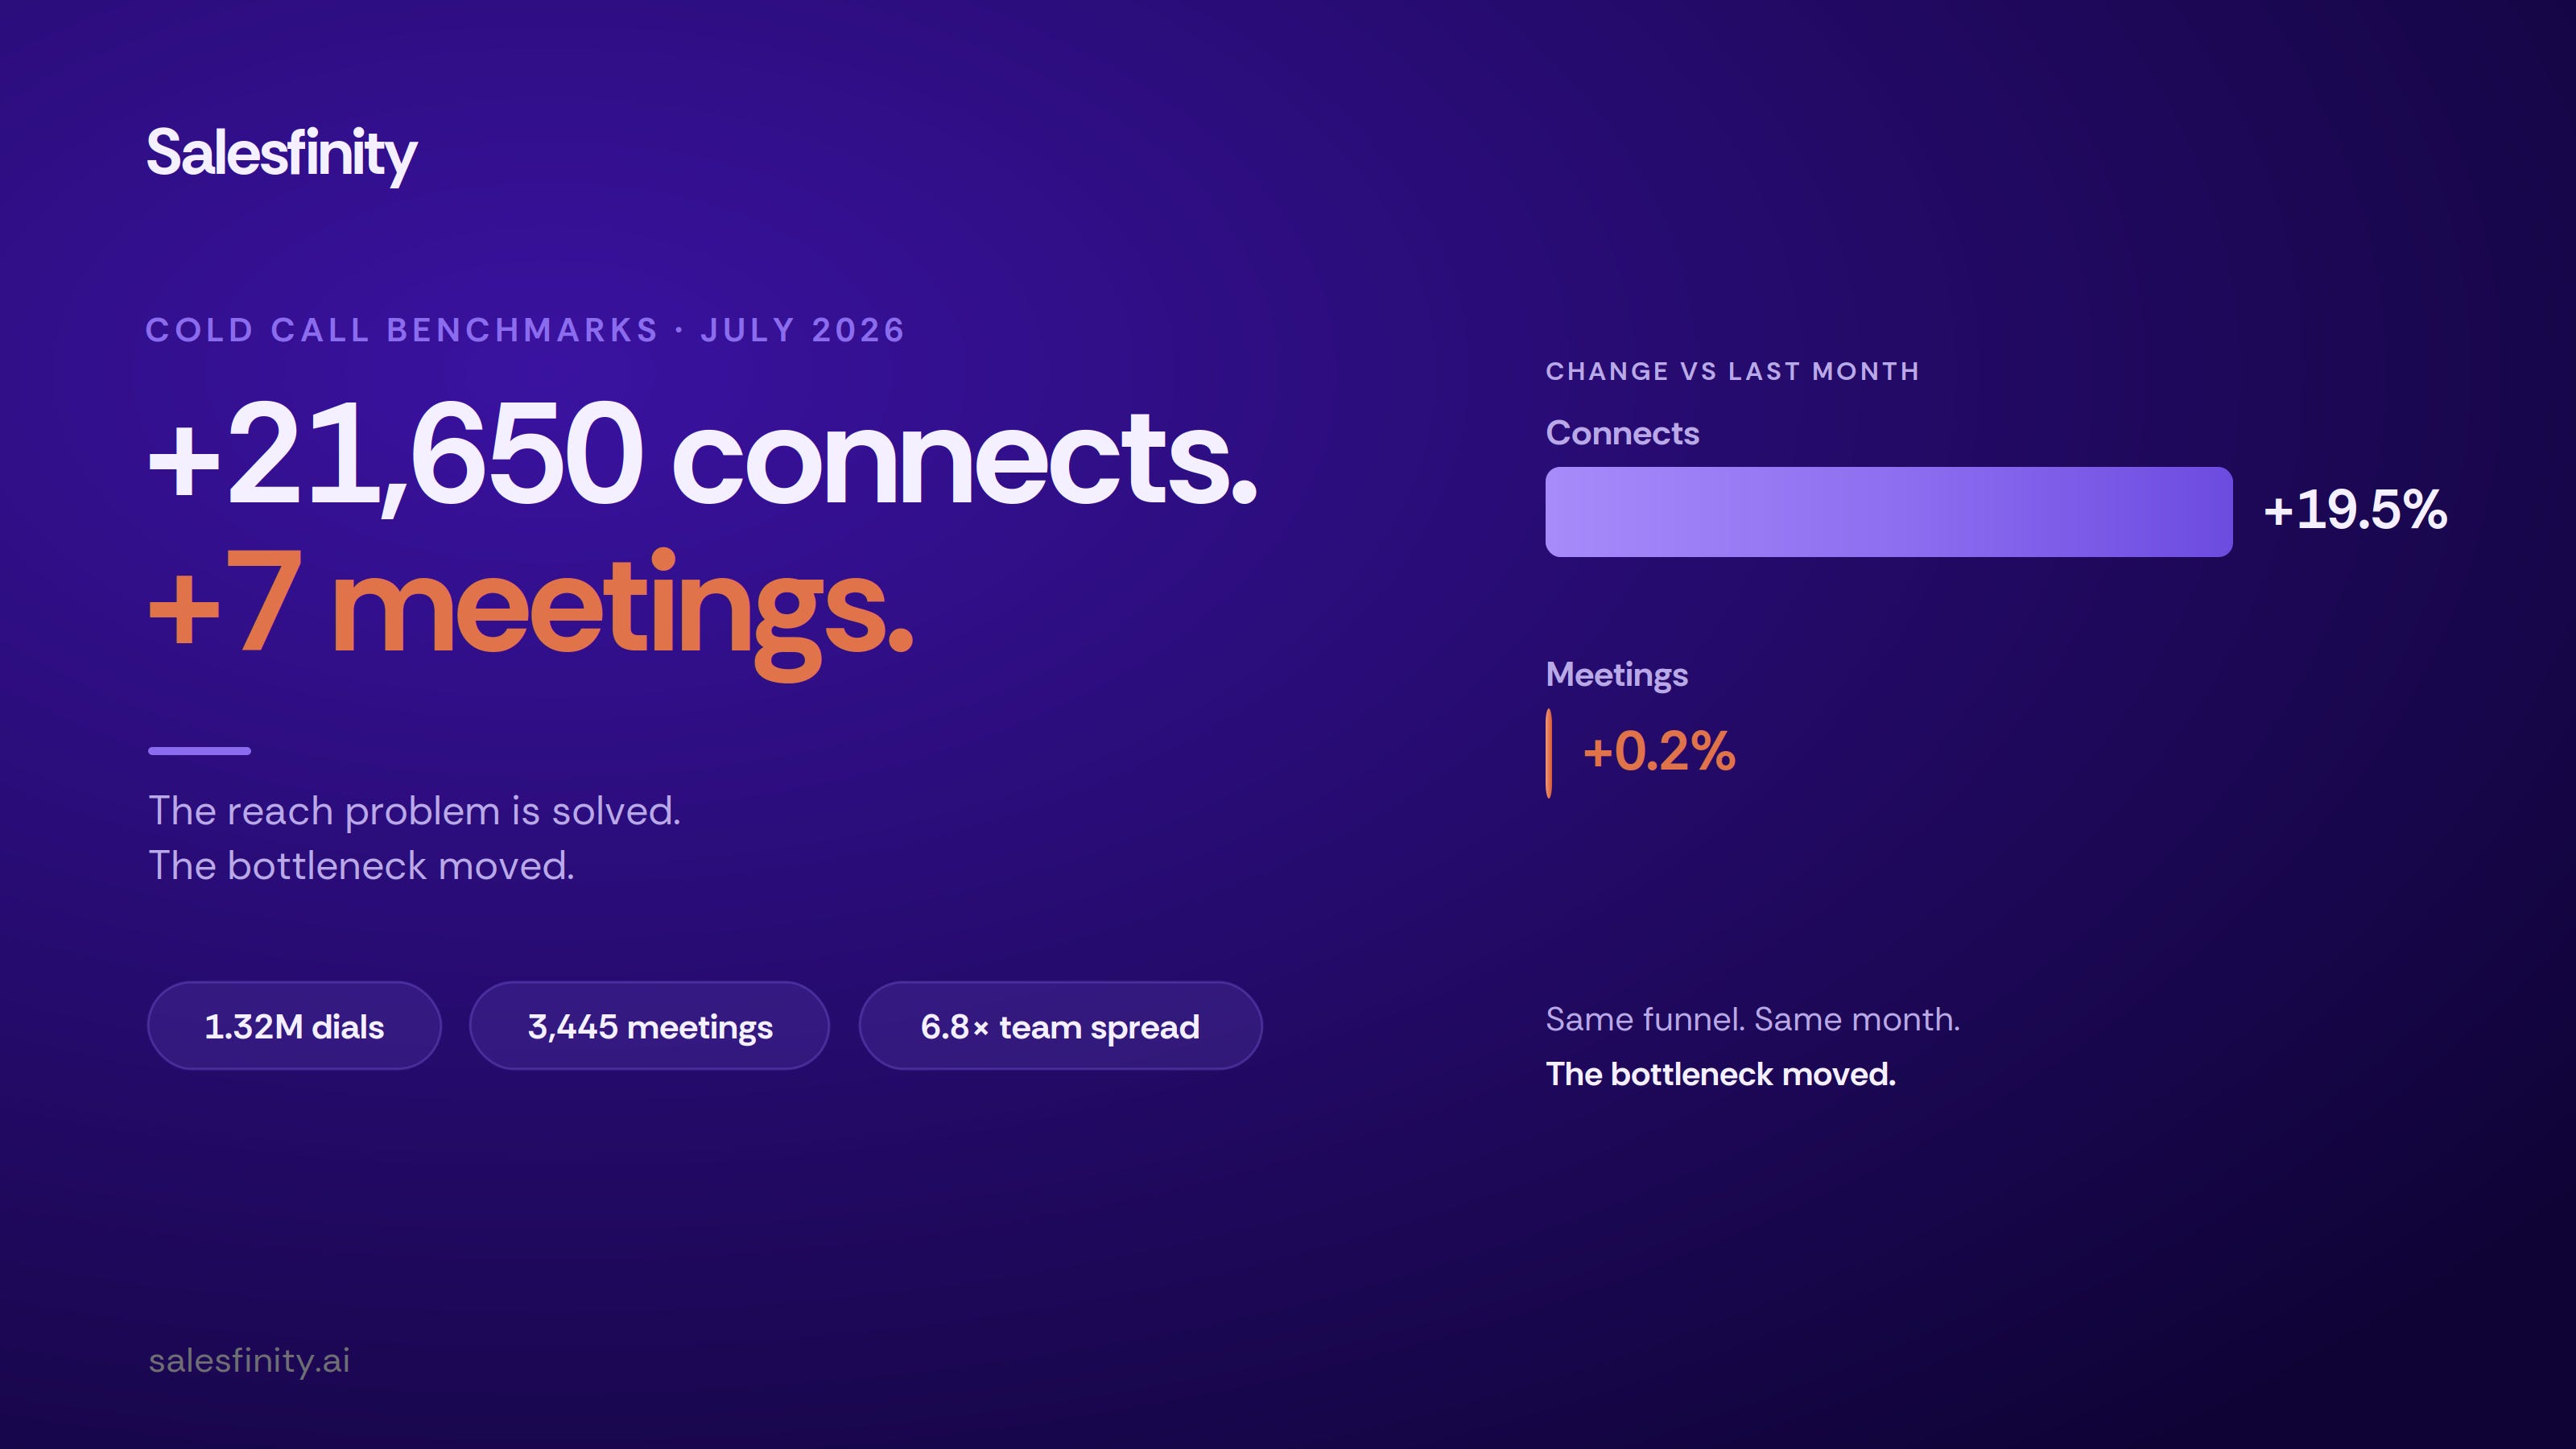
Last month, the platform did 111,032 connects and booked 3,438 meetings.
This month: 132,682 connects. 3,445 meetings.
That’s 21,650 more live human beings picking up the phone — connects up 19.5% — for seven more meetings. Not seven hundred. Seven.
Here’s the part most people will read wrong: this is not a story about cold calling getting harder. The connect rate went up 14%, to 10.1%. By every measure this industry has obsessed over for a decade, we won. Reaching people is a solved problem.
The meetings just didn’t follow. Which tells you something worth more than any tactic in this issue: the constraint isn’t at the top of the funnel anymore. It moved. Most teams haven’t noticed, and are still spending their budget and their standup time on the part that’s already fixed.
This Month’s Snapshot
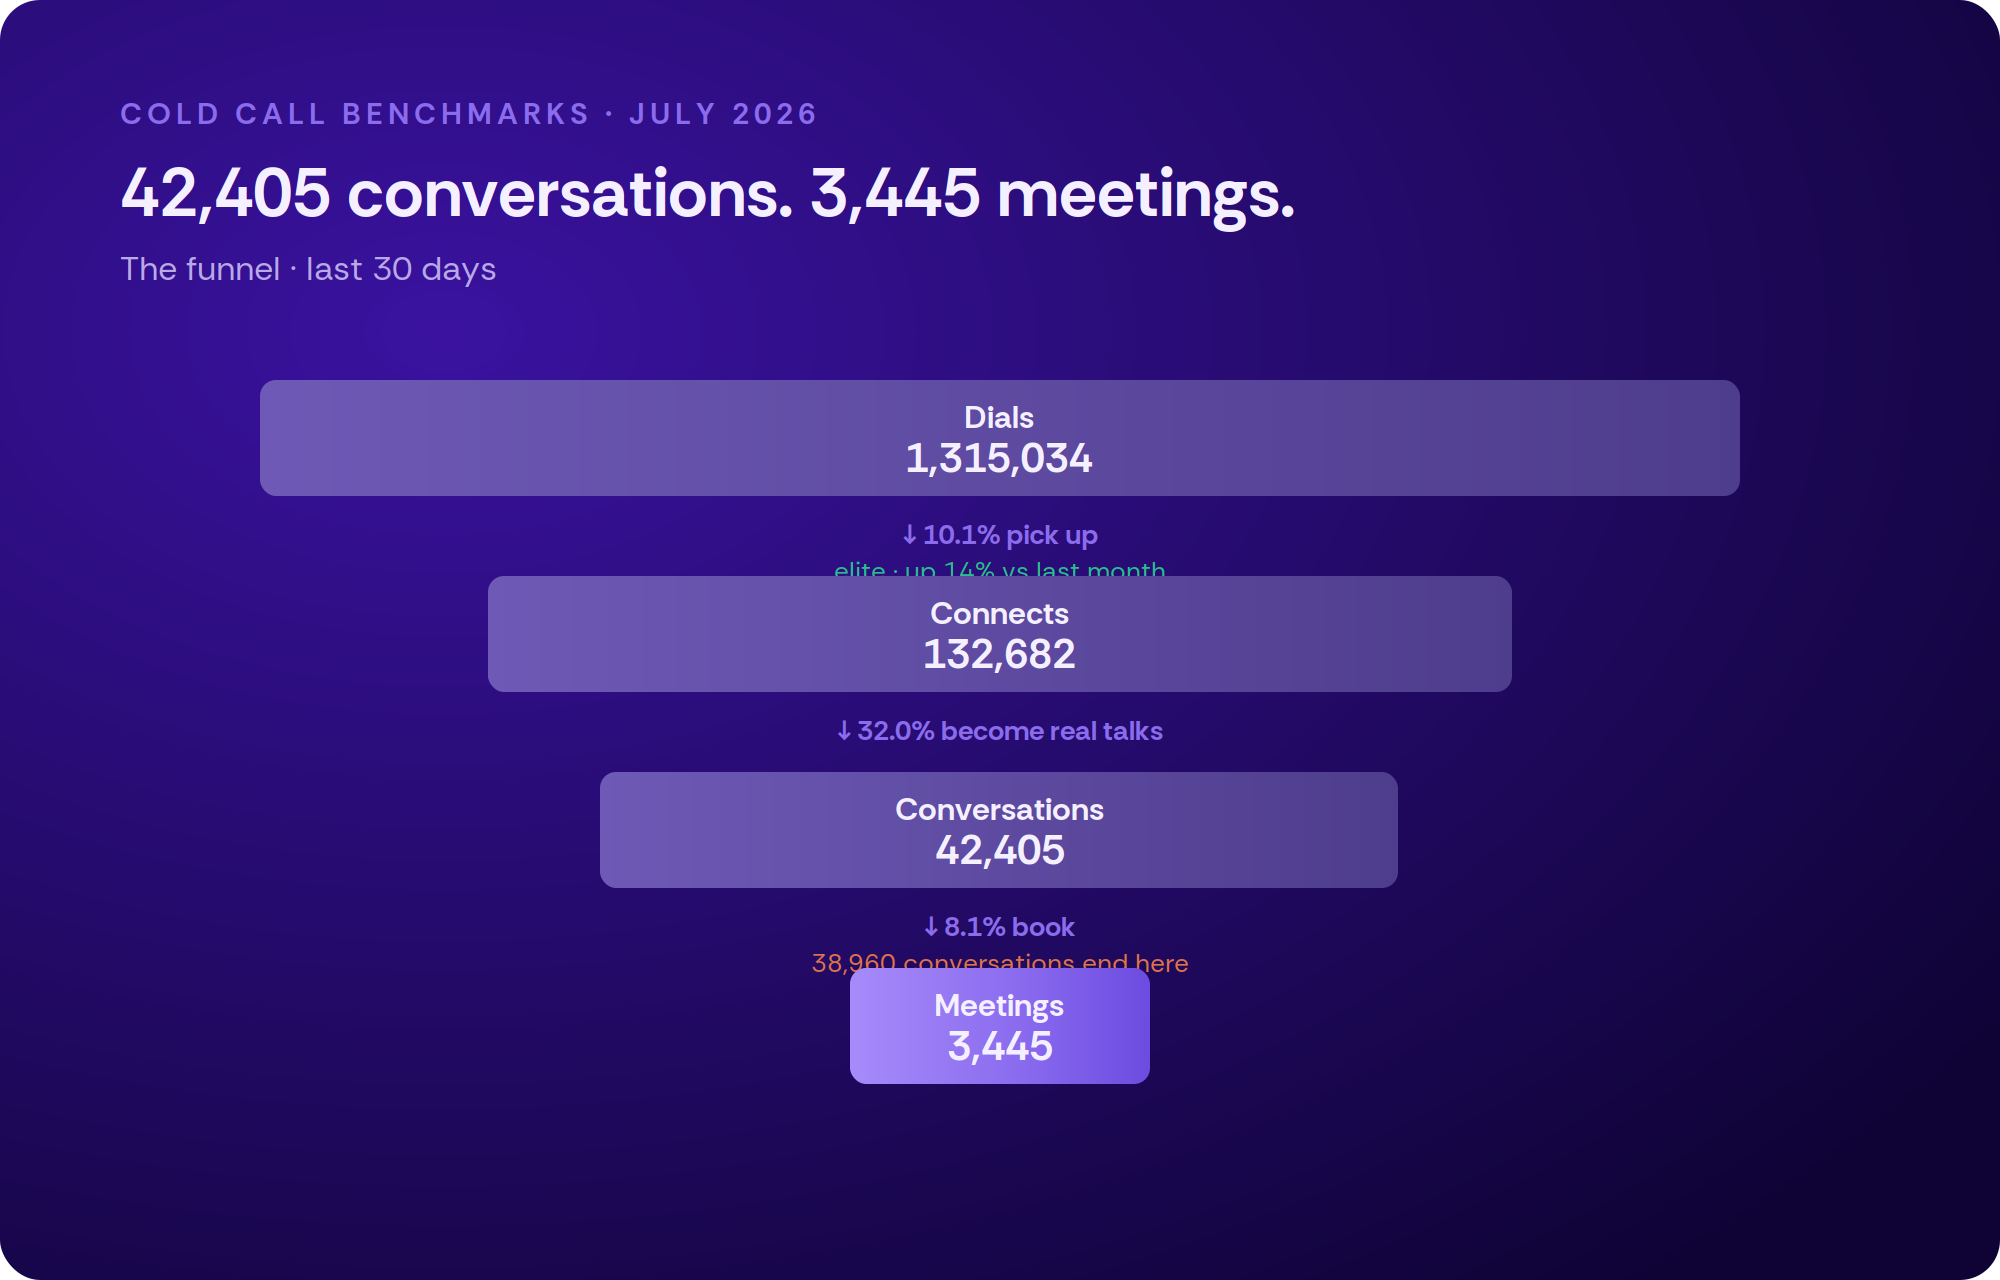
Stage Count Rate Dials 1,315,034 — Connects 132,682 10.1% Conversations 42,405 32.0% Meetings 3,445 8.1%
The Headline Number: 10.1% dial-to-connect. Most B2B teams live in the 3–8% band. This is elite, and it’s up 14% relative to last month. Nobody reading this has a reach problem.
Heat Index: 🔥 at the top, 🧊 at the bottom. The engine is redlining and the car is going the same speed.
Hidden Gem: 42,405 conversations happened. 3,445 became meetings. 38,960 real, live, human conversations ended with nothing on the calendar — and that pool is growing faster than the meetings are, because we’re generating conversations faster than we’re converting them.
Why It Matters: You can now manufacture conversations more or less at will. What you can’t manufacture is what happens inside them and immediately after them. That’s where the pipeline is going, and it’s the only part of the funnel that isn’t already solved.
The Benchmark Card
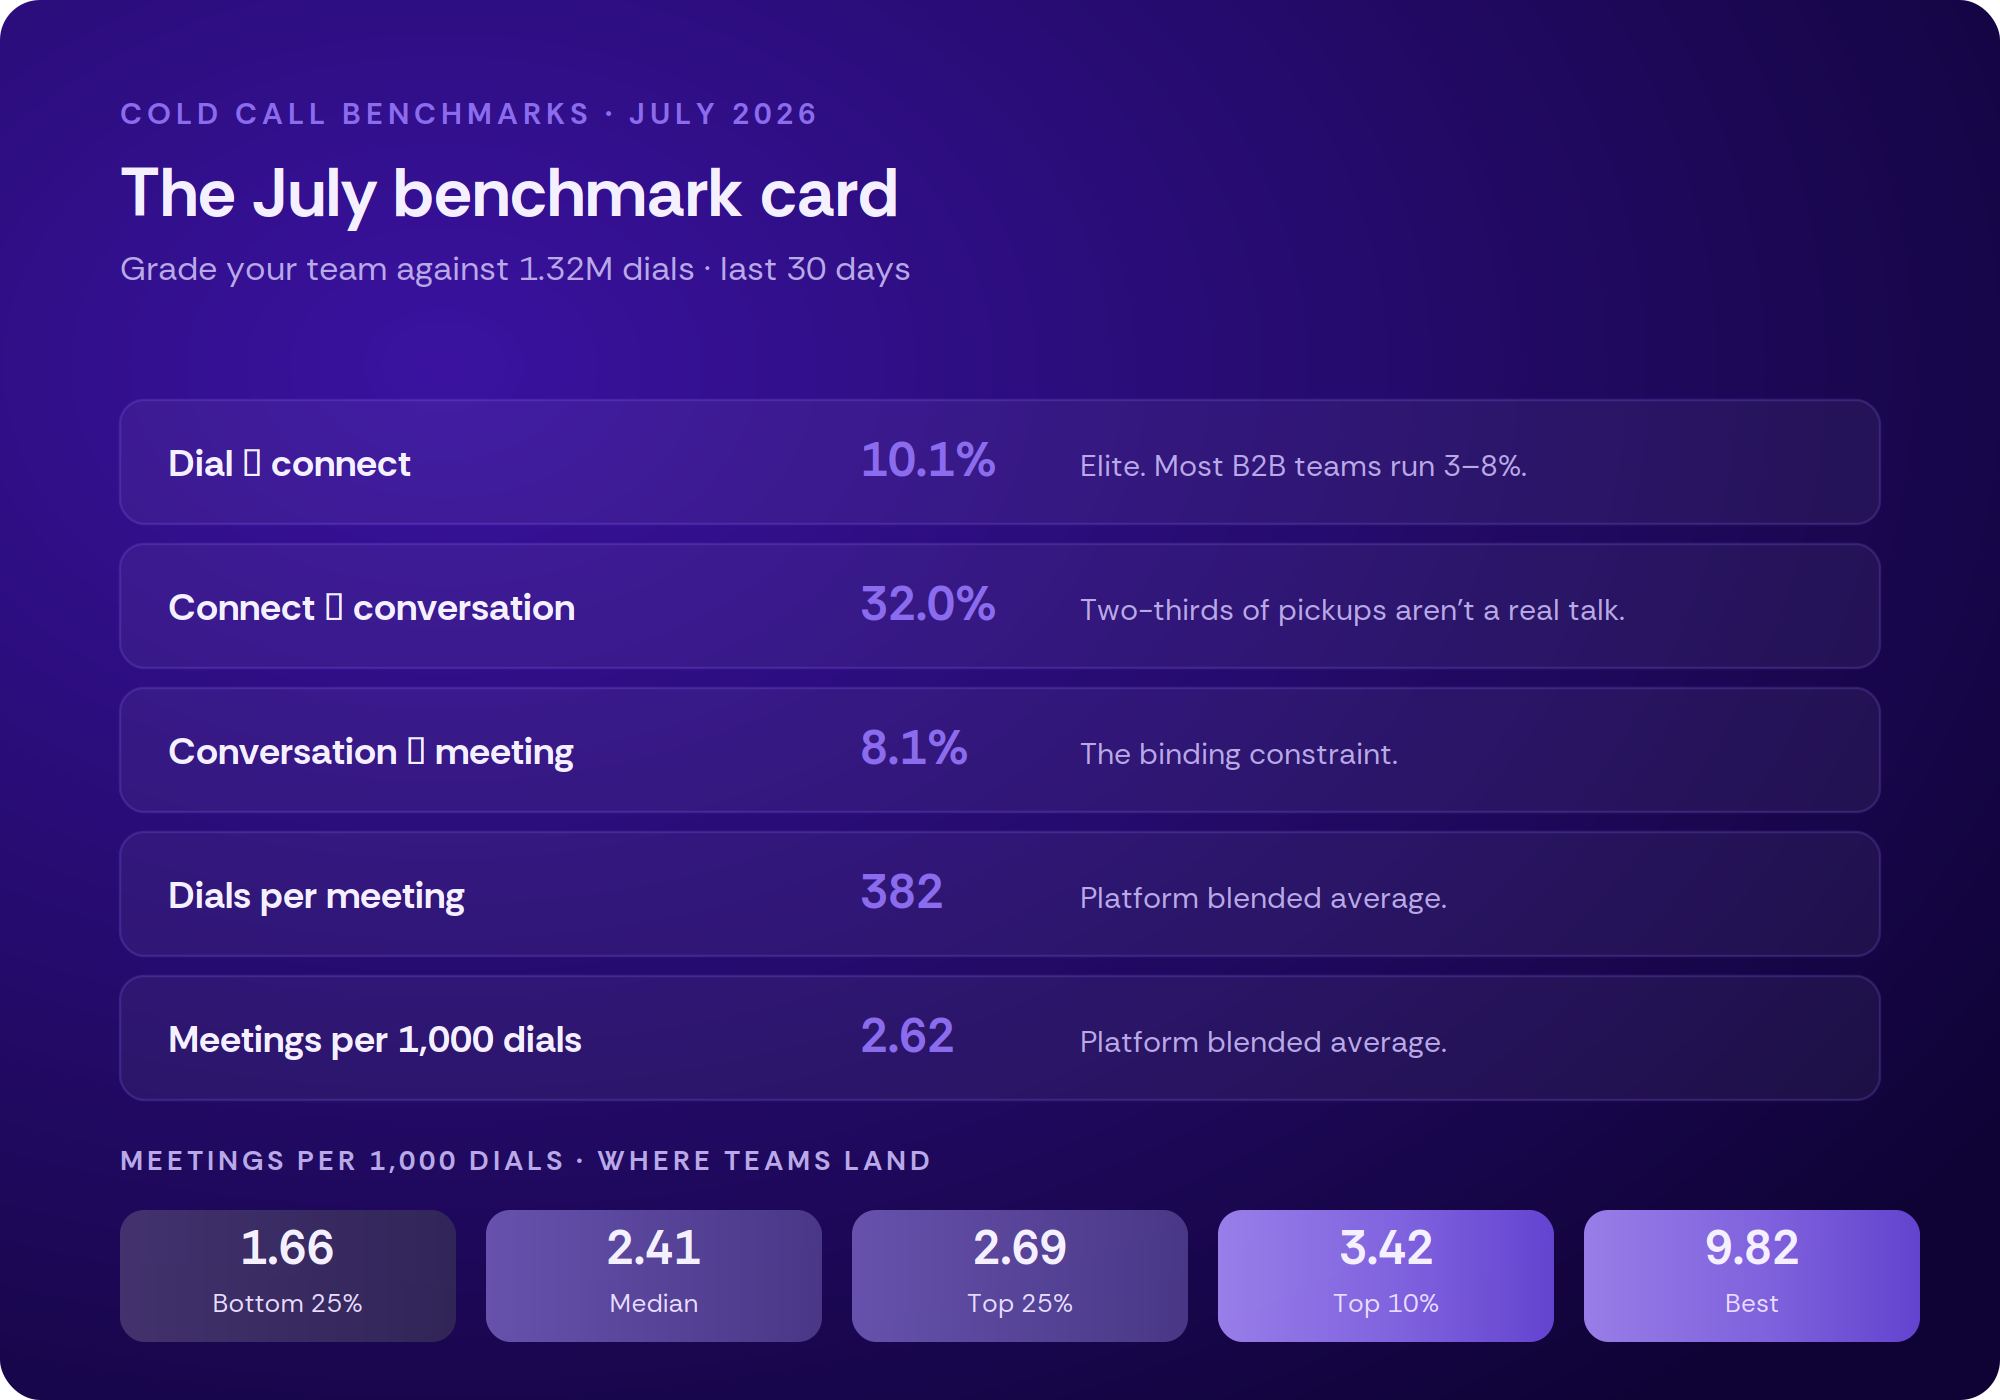
Grade yourself. Meetings per 1,000 dials = meetings ÷ dials × 1,000.
Metric Platform Notes Dial → connect 10.1% Elite. Most teams: 3–8% Connect → conversation 32.0% Two-thirds of pickups aren’t a real talk Conversation → meeting 8.1% The binding constraint Dials per meeting 382 Blended average Meetings / 1,000 dials 2.62 Blended average
Meetings / 1,000 dials Percentile Translation 1.66 Bottom 25% ~600 dials per meeting 2.41 Median 415 dials per meeting 2.69 Top 25% 372 dials per meeting 3.42 Top 10% ~290 dials per meeting 9.82 Best on platform 102 dials per meeting
If you take one thing from this issue: find your row. Most managers have never computed this number — which is exactly why most managers are still optimizing dial count.
Key Trend: Reach Is Not the Constraint
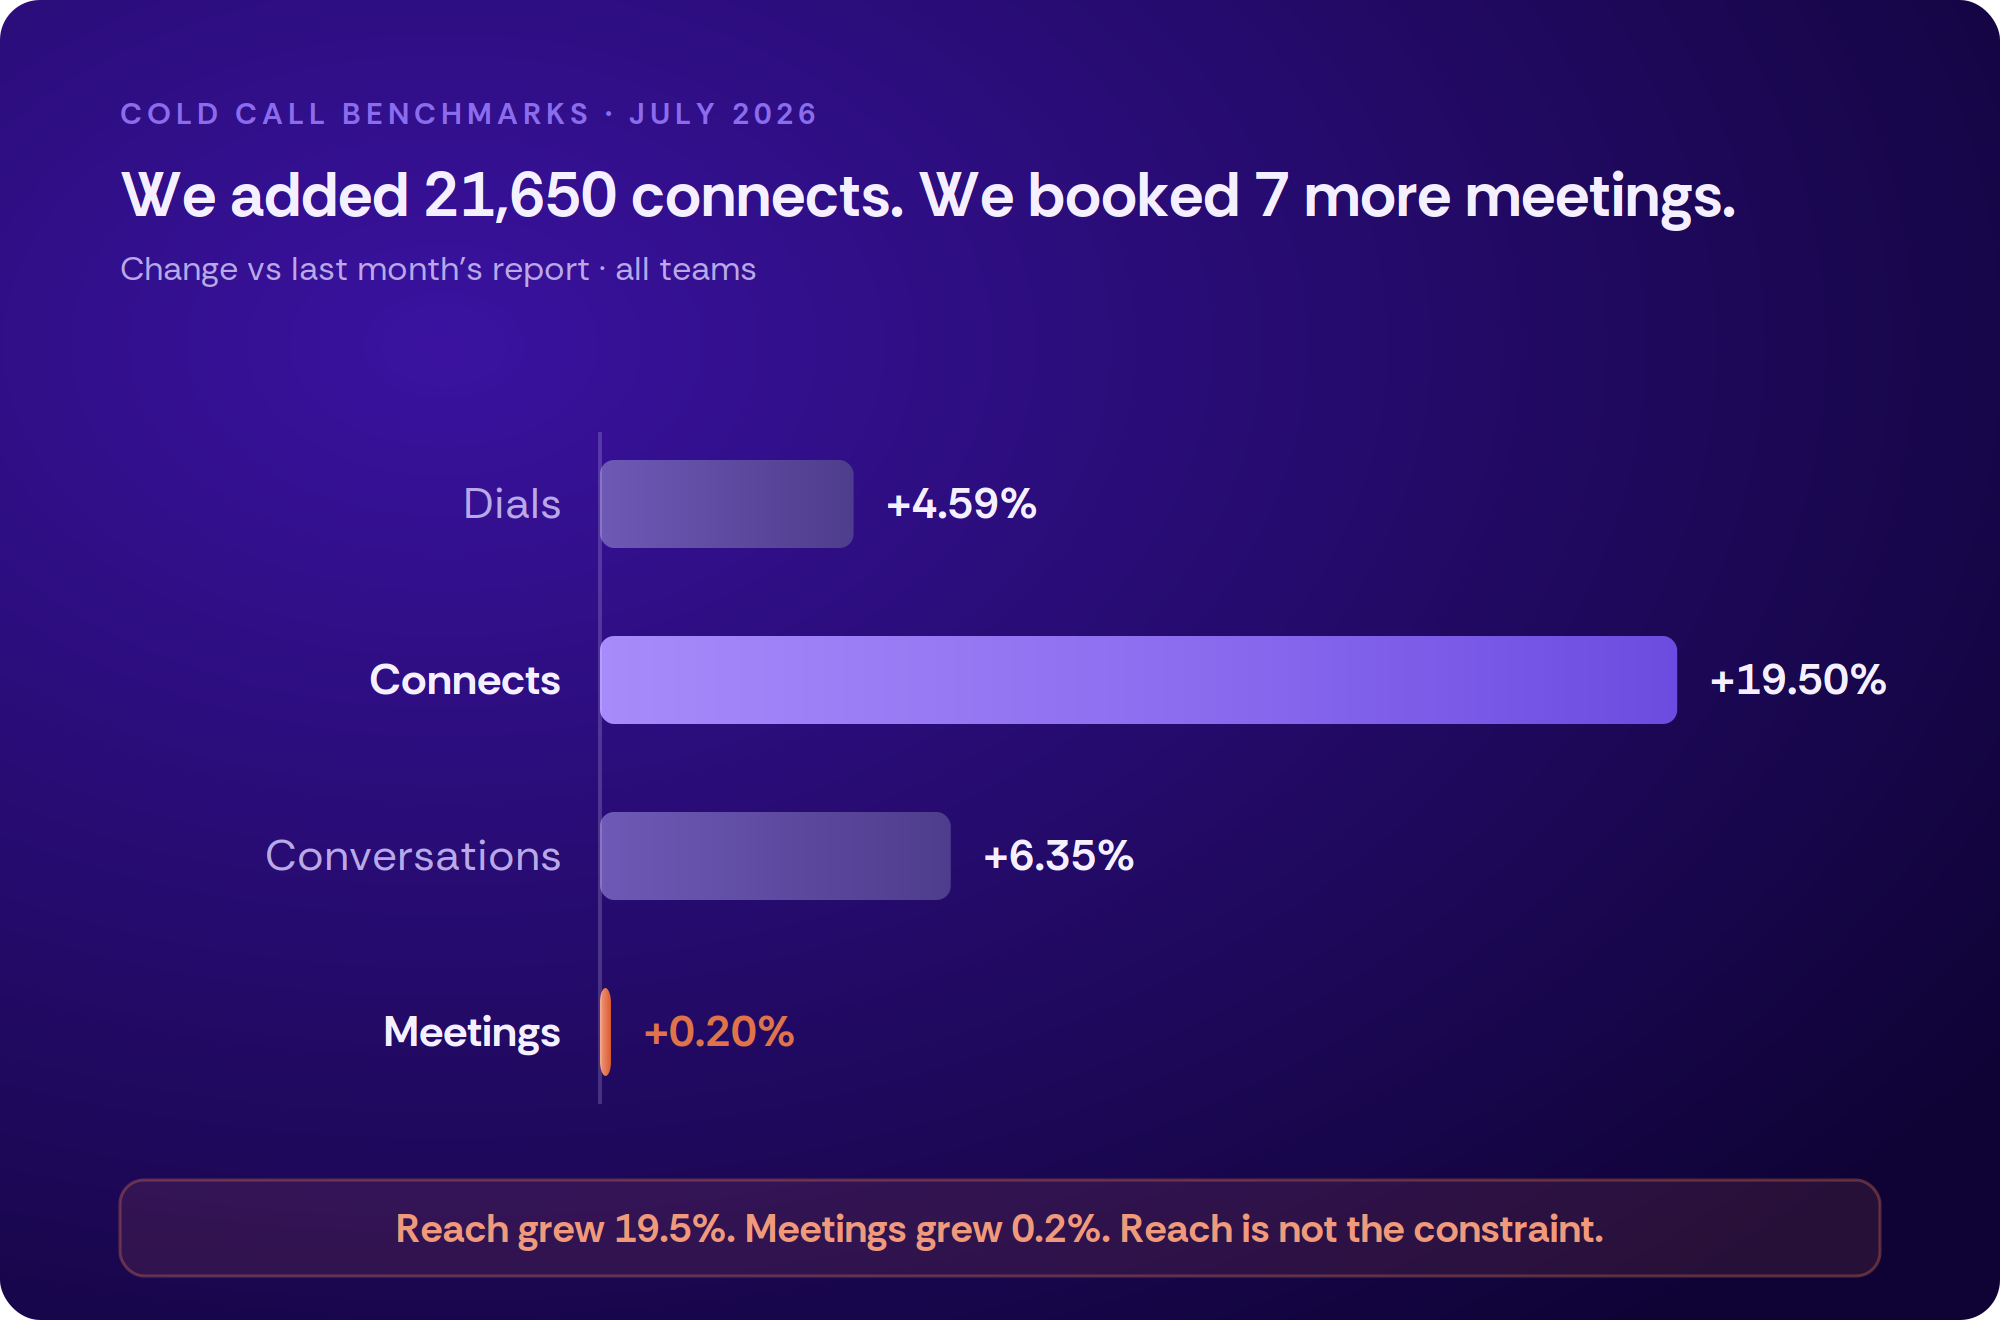
The Pattern: Dials +4.6%. Connects +19.5%. Conversations +6.4%. Meetings +0.2%. Every stage grew except the one that pays the mortgage.
The Context: The lazy read is “the extra connects were junk.” Be careful — reaching more people and reaching the right people are two different problems, and the disposition data below tells you exactly which one you have. Reach scales with technology. Relevance doesn’t.
Mini Case Study — two real teams, same month, same dialer:
Dials Meetings Meetings / 1k Team A −2.6% +35.3% +38.8% Team B +87.1% −27.2% −61.1%
Team B nearly doubled its dial volume and booked a quarter fewer meetings. Team A cut dials slightly and booked a third more. If volume were the lever, this table would be impossible. It isn’t — because the lever is which conversations you create, and what you do with the ones that don’t convert today.
Test This: Pull your last 500 connects and tag each one: right person or not the right person. If more than a third land in the second bucket, your connect rate is a data-quality metric wearing a performance metric’s clothes.
Competitive Edge: Your competitors are running the same “boost your connect rate” playbook you ran last year. It works — and it’s finished. The teams that win the back half of this year are the ones who notice the constraint moved downstream and reallocate first.
Quick Win: The Second Question
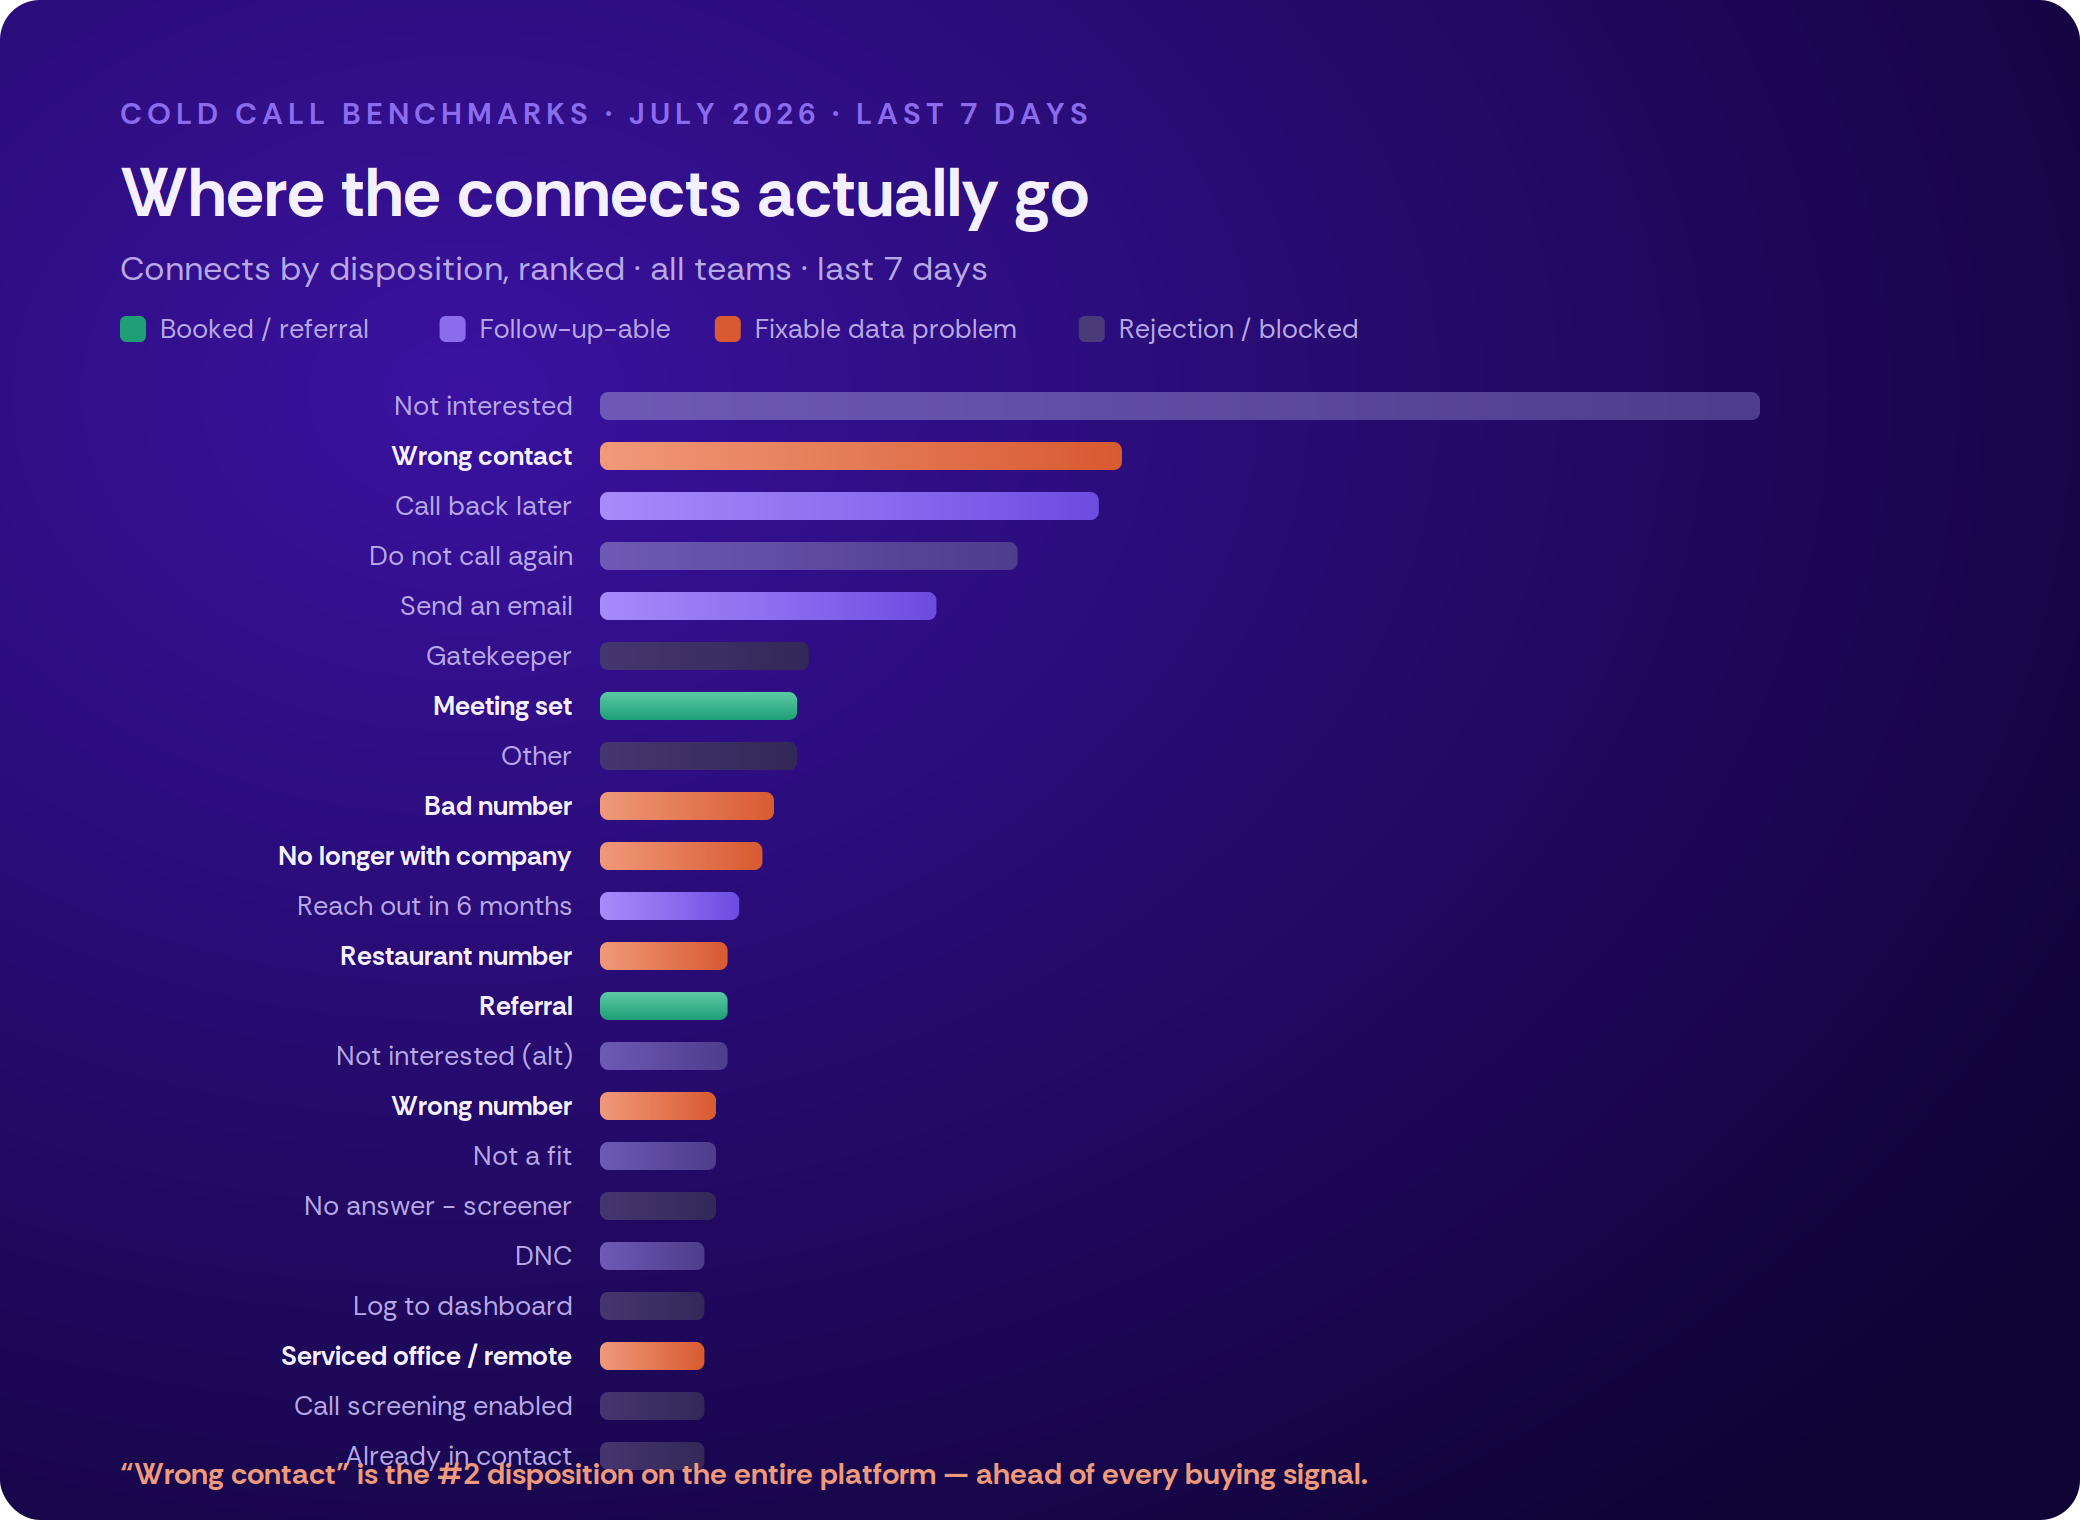
Look at the ranked dispositions. “Wrong contact” is the #2 outcome on the entire platform — ahead of “call back later,” ahead of “send me an email,” ahead of every buying signal we track. Add “bad number,” “no longer with the company,” “wrong number,” and the restaurant/serviced-office noise, and a brutal share of your connects were dead before anyone dialed.
The Tactic: Stop asking “how do we get more connects?” — you’ve won that. Start asking the second question: “what happened to the connects we already got?”
By the Numbers: You’re reaching 132,682 humans a month, and 32% of them become a real conversation. The gap isn’t reach. It’s that a large share of those pickups were never your buyer in the first place.
Psychology Corner: There’s a reason teams chase connect rate — it’s the only funnel metric that feels like effort. It moves when you work harder. Relevance moves when you think harder, and thinking doesn’t show up on a leaderboard at 4pm. Managers optimize what’s visible.
Implementation:
Validate numbers before they hit the dialer (Boss Mode), so a pickup is a real pickup.
Run SmartEnrich on every list — wrong contacts swapped, dead numbers replaced, referrals surfaced inline, without the rep stopping to research.
Re-measure on connect-to-conversation, not connect count.
Common Challenge: A 6.8× Gap on Identical Tools
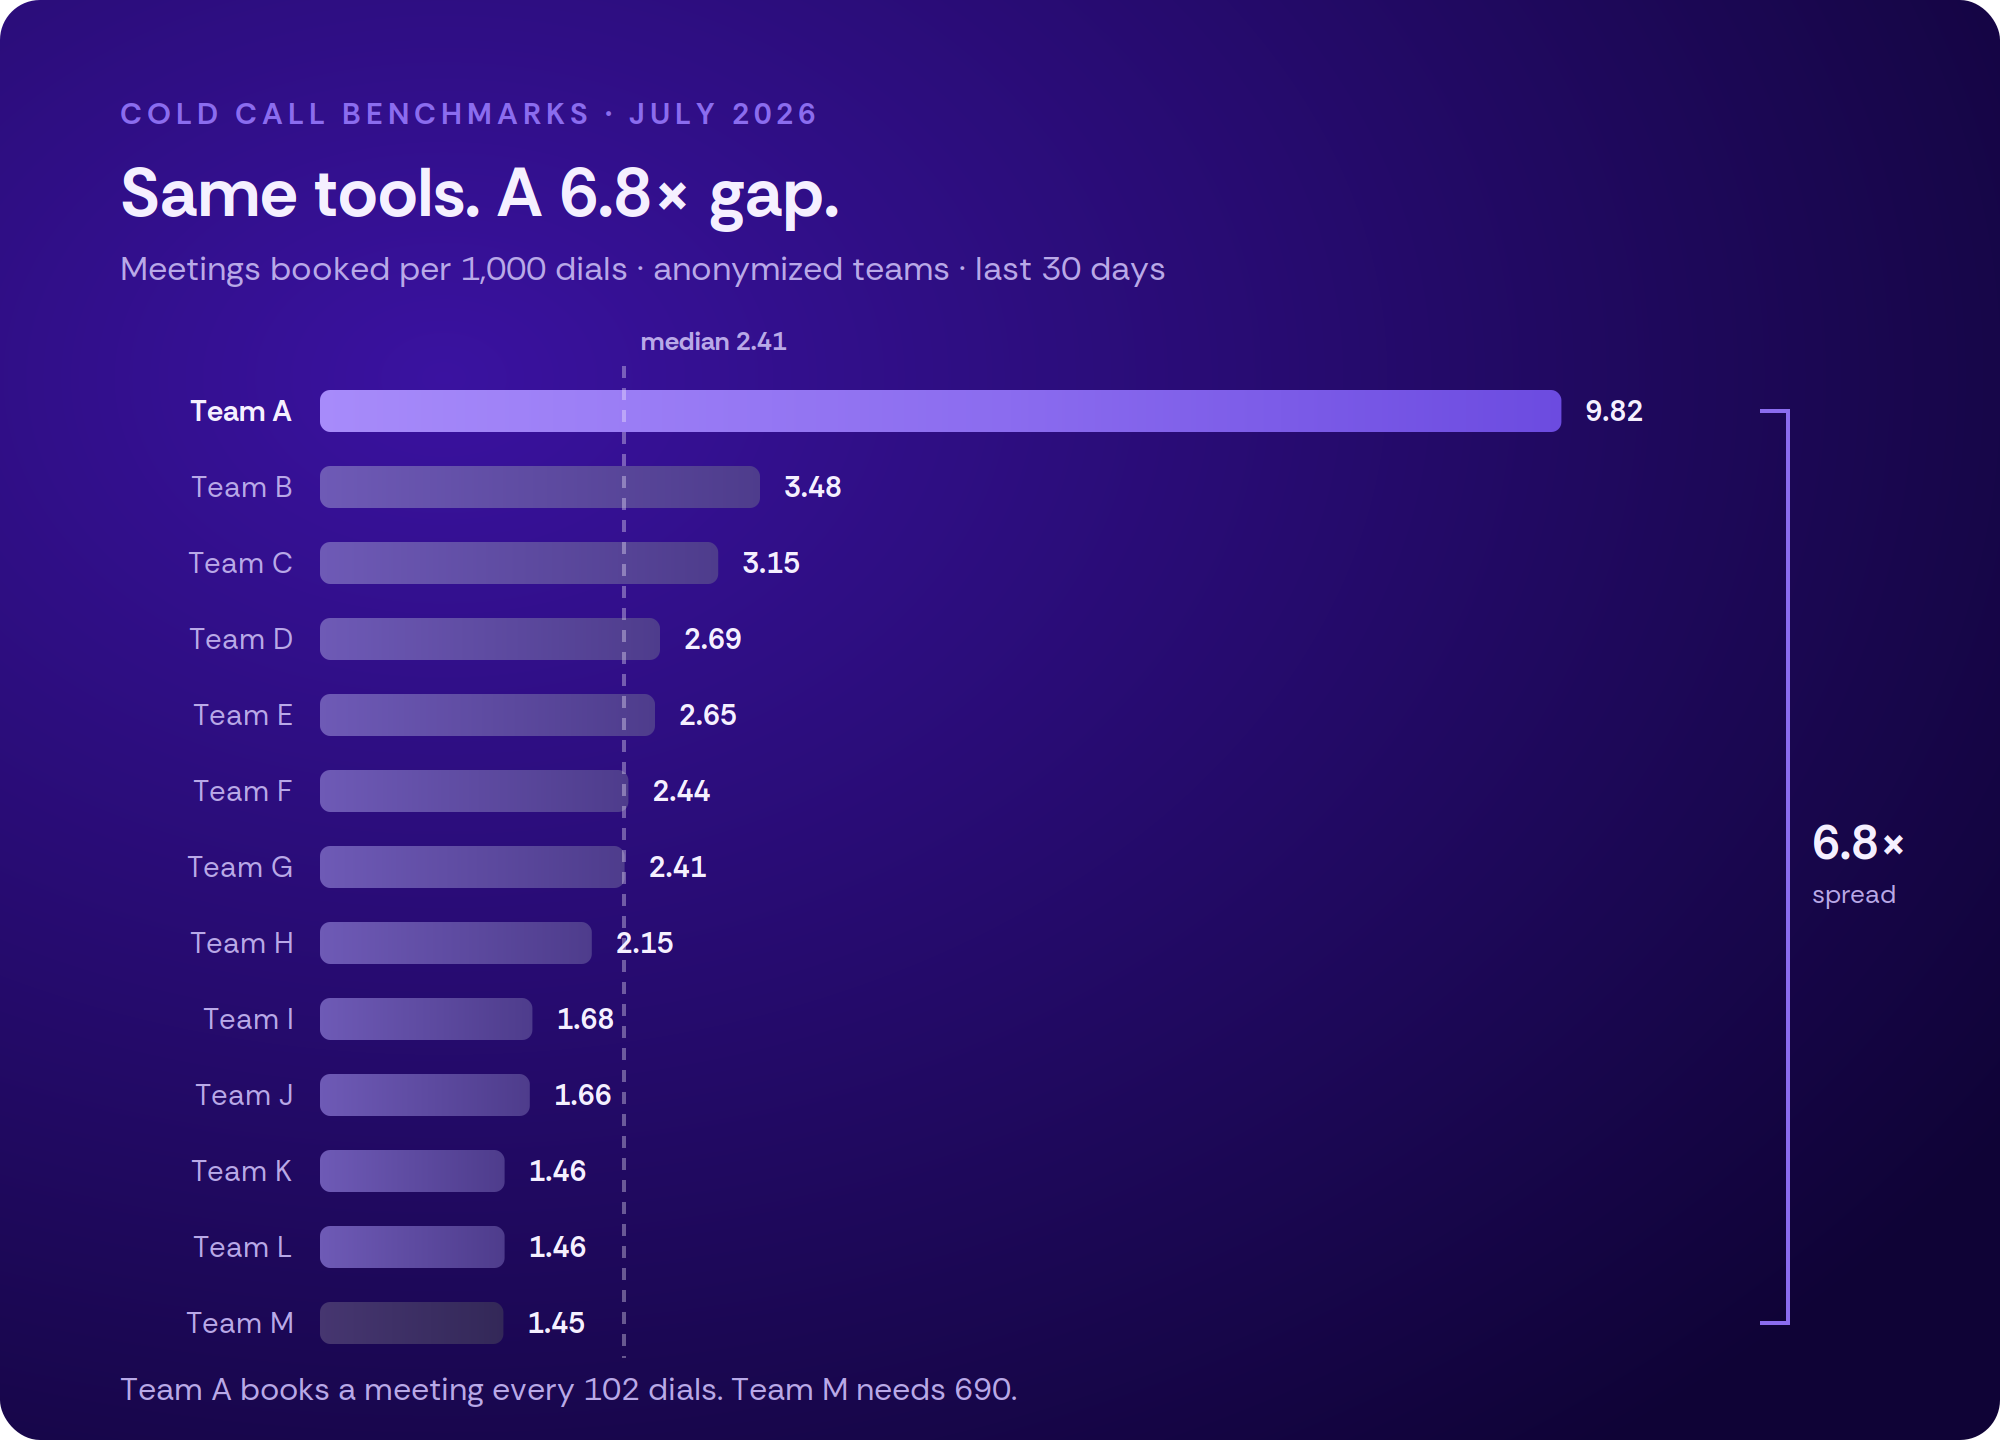
Diagnostic: The best team on the platform books a meeting every 102 dials. The weakest needs 690. Same dialer, same month, same economy — a 6.8× spread.
Root Cause: Look at the shape of it. The platform’s single highest-volume team — 189,425 dials — sits at 2.15, below the median. Volume is not the variable. Even throwing out the top outlier, the remaining spread is 2.4×, which is still the difference between hitting your number and missing it.
Solution Matrix:
Quick: Change the leaderboard metric from dials to meetings per 1,000 dials. Rankings reshuffle within a day, and your quiet converters finally get credit.
Medium: Audit the bottom quartile’s lists, not their call recordings. At 690 dials per meeting, it isn’t the pitch.
Deep: Document how your best team builds and works a list, then copy it. That’s where the 6.8× actually lives.
Conversation Guide: “You made 690 dials for one meeting. Your teammate made 102. I’m not going to ask you to dial harder — you’d need 5,000 calls to catch up and you’d quit first. Let’s look at who you’re calling instead.”
Short Tip: Stop Crowding Wednesday
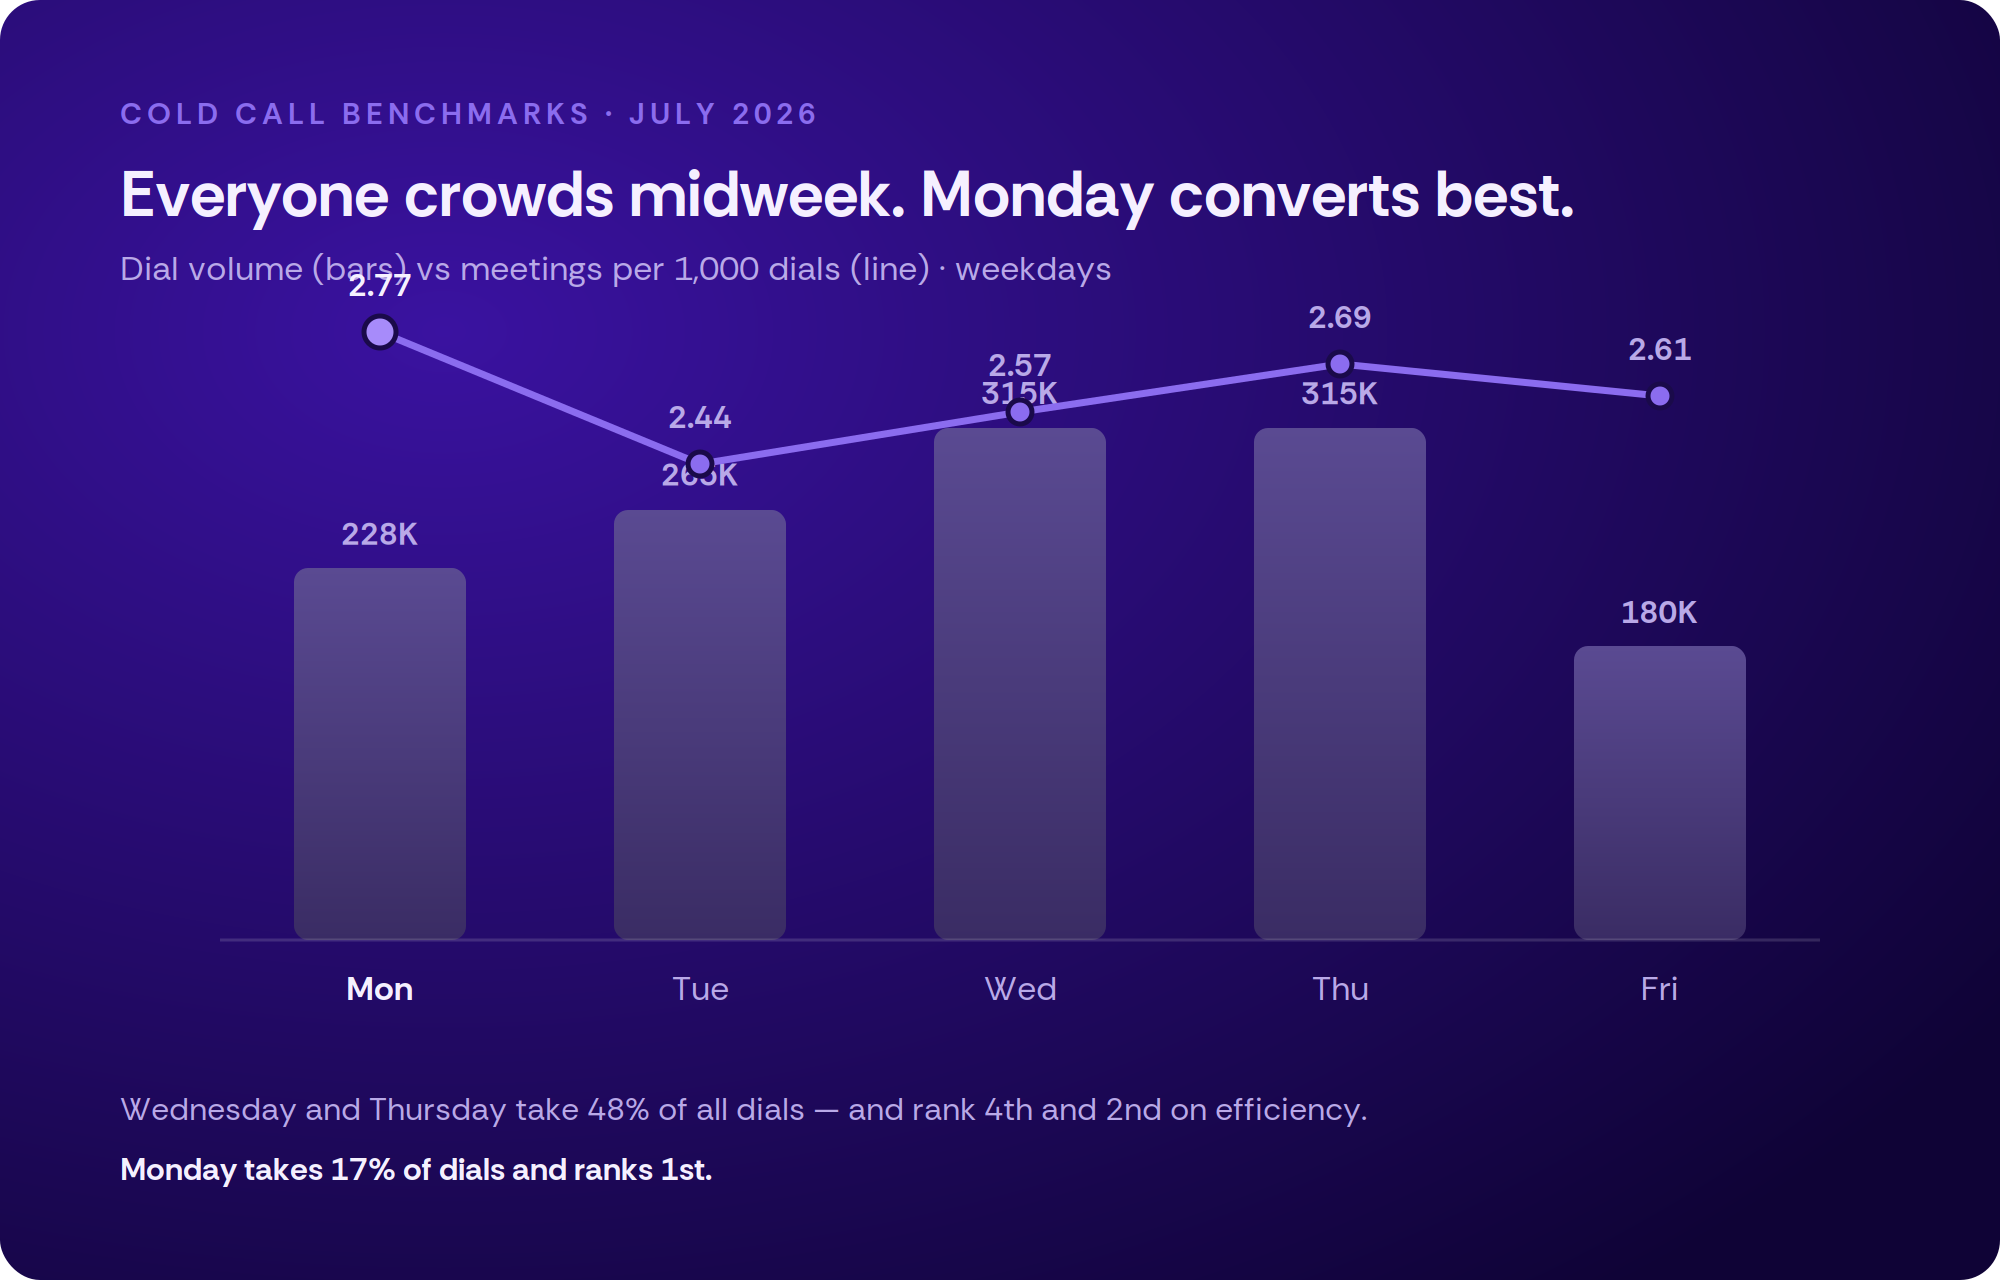
Wednesday and Thursday absorb 48% of every dial on the platform. They rank 4th and 2nd on efficiency.
Monday takes 17.4% of dials — and ranks 1st, at 2.77 meetings per 1,000 dials, 14% better than Tuesday, the worst weekday. Last month we told you midweek is where meetings get booked. Now that we have dial volume, we can normalize it, and the honest correction is this: midweek is where meetings get counted. Monday is where they get earned. Midweek only wins on raw totals because that’s where everyone piles the volume.
Move 10% of Tuesday’s dials to Monday. Change nothing else.
Your Action Step This Month
What: Compute your meetings per 1,000 dials and find your row on the benchmark card. Then run the Second Question audit — sort last week’s connects into right person / wrong person, and fix the inputs instead of pushing for more volume.
When: Before your next Monday standup. It’s a 30-minute exercise and it will reframe your quarter.
How to Measure: Two numbers, weekly. Connect-to-conversation rate (platform: 32.0%) and meetings per 1,000 dials (platform median: 2.41). If connect count flattens while those two climb, you are unambiguously winning.
Watch Out For: Your reps will hear “fewer dials” and panic. Your VP will see connect count flatten and ask questions. Get ahead of both with the number at the top of this issue: 21,650 extra connects bought this platform seven meetings. Nobody’s quitting the volume game — we’re just done pretending it’s the whole game.
Methodology & Notes
We publish these so you can pressure-test us.
Windows: This issue covers the trailing 30 days (~Jun 17–Jul 17). Last month’s covered ~May 13–Jun 12. Consecutive, non-overlapping.
What we are and aren’t claiming: The connect and meeting counts above are platform totals for each period — facts. Team composition changed between periods, this window contains the July 4 holiday, and our team-level exports are truncated — so period-over-period rate changes below the connect stage can’t be cleanly attributed. We report those stages as levels, not trends.
Mini case study: Team A and Team B are two real, anonymized teams present in both periods, shown as illustration — not as a population claim.
Team spread: n = 13 teams with both dial and meeting volume in-period. Labels are randomized every issue and don’t persist between editions.
The Call Report is published by Cold Call Benchmarks at Salesfinity.ai. Got data you want analyzed? Reply to this email.